If you have landed here, I am sure you already know what NPS aka net promoter score is.
NPS is a business metric that helps you gauge customer loyalty by asking a simple question, ‘How likely are you to recommend us to a friend or colleague?’
While this has been widely used in organizations, some brands only focus on increasing the score. And when it doesn’t work they believe that it has been outdated!
But NPS is not just a score to increase, it is a system that helps you identify the gaps in your customer experience.
And for that, the loyalty question is not enough! You need to focus on its follow-up question because that is where the gold is!
But people who are new to NPS don’t know where and how to make use of the NPS verbatim. And for those, after working with over 200 brands, we created a process that successfully helps in analyzing their NPS verbatim.
6 Super-Effective Steps to Analyze the Responses of your NPS Program
So, here’s a 6-Step Process for efficiently analyzing NPS responses.
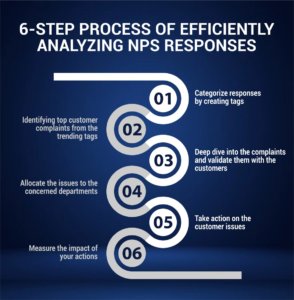
Step 1: Categorize the NPS Responses by Creating Tags
Reading customer feedback and identifying common problems can be really tedious. Especially when you receive volumes of it! So, here’s what you can do.
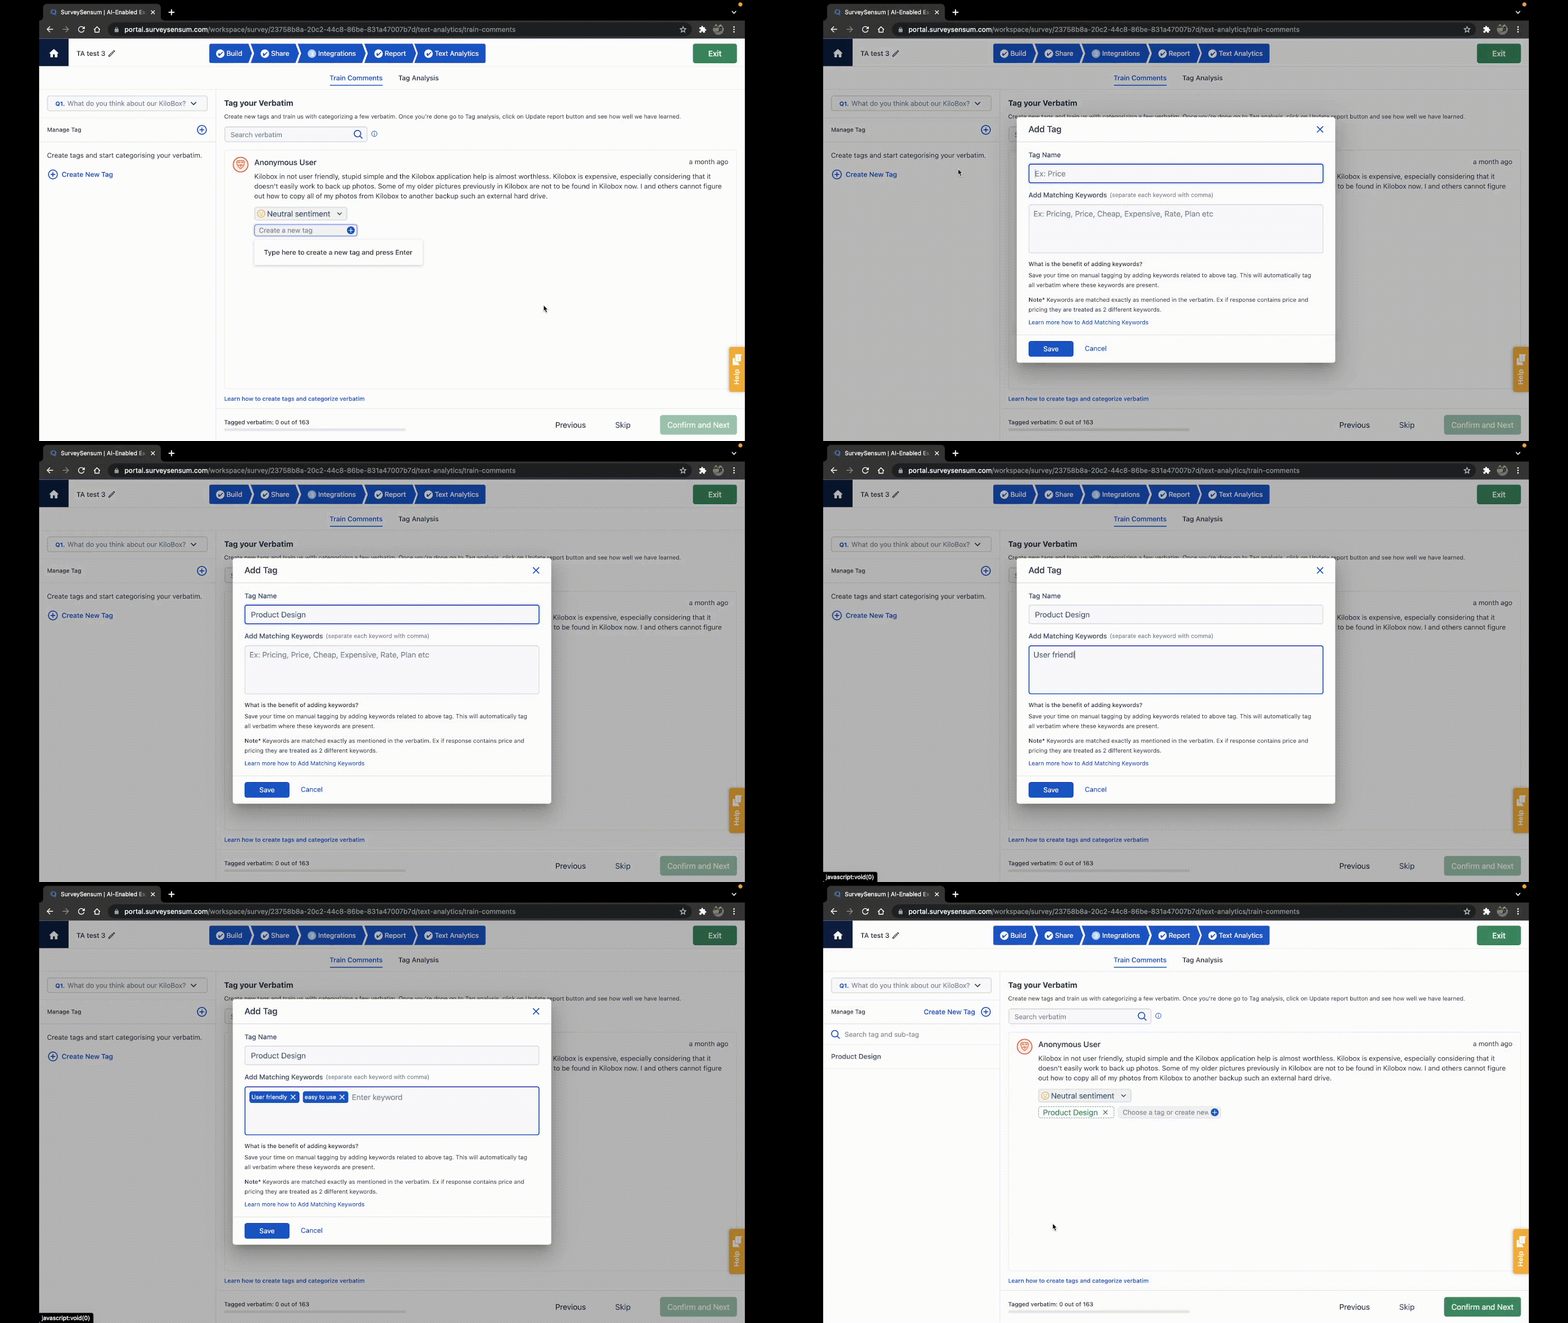
After shooting the NPS survey, once the open-ended responses start rolling in, start categorizing responses into tags.
You can create your tag list according to the
- Department (product, support, tech, accounting, pricing)
- Functionality (bugs, ease of use, speed, automation)
- Features, etc.
It will help you
- Identify trending topics based on their occurrence and importance and
- Assigning issues to the departments so that they can create an action plan accordingly.
You can do this simply in an excel sheet if you have 100 or fewer responses.
But when you have thousands of customer feedback, tagging all that feedback from NPS surveys is really challenging.
That’s why we created Text and Sentiment Analysis.
The AI-enabled Text and Sentiment Analysis automates the entire process of tagging and saves hours of your manual work.
Here’s a quick example of how you can create a tag list and add keywords to tags using SurveySensum.
You can click here to know more about text and sentiment analysis.
Now that we have tagged all of the responses, let’s understand how to identify the common complaints from it.
Launch FREE surveys with SurveySensum
Step 2: Identify Top Customer Complaints from the Trending Tags
Your tag list is made and your keywords are finalized, now it’s time to identify the most talked about topics by your customers. They can be anything from pain points to the best features.
Since you might have a lot of tags, you have to prioritize which ones to work on.
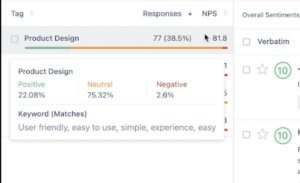
To know that, check for the 3-5 pain points by identifying the tags that have
- The maximum frequency
- A negative sentiment
- A low NPS number
This analysis will help you identify areas of improvement in your existing product or service or customer experience.
After identifying the areas of improvement, don’t forget to check the tags with
- Positive sentiment
- High NPS number
This will help you recognize the features/processes/teams that are performing well. This kind of customer feedback helps you to ask for referrals, promote high-performing features, and encourage employees.
But now that we know what the most talked-about problems are, we need to validate them with the customers before taking any action. Calculate your NPS score with our NPS calculator
Step 3: Deep dive into the Complaints and Validate them with Customers
Most customers never really mention all the details of the issues they are facing. They usually just mention:
“I like the App”
Or
“I hate the App. It crashes every time”
In such cases, it is really easy to identify the trending tag [ex.‘App Crash’ in this case] but it becomes difficult to get into the depth of the issue [ex. when does the app crash, what is the frequency of crash occurrences, what triggers it, etc].
To understand more about this issue
- Analyze if it’s been talked about on other channels as well [ex. support tickets, review platforms]
- Involve front-line employees to incorporate their learnings
- And most importantly, talk to the customers. Follow up with them. Empathize, apologize, and understand what went wrong and what are their expectations around it. This is what closing the loop is all about.
And the process differs in B2B and B2C.
In B2B cases, you just have a few responses. It is easier to check comments, validate data, take immediate action and close the feedback loop instantly with each customer.
However, in B2C, where there is a volume of customer feedback, contacting customers or following up becomes an impossible task. In these cases, you can identify and prioritize the trending topics, cross-validate with a handful of customers, and deep dive further into the issue to build an actionable plan.
Now that we know what the issues are, it’s time to take action on them.
Step 4. Allocate the Issues to the Concerned Departments
NPS is not the sole responsibility of the Founder. All the Heads of Departments, CX, Customer Success, and everyone from the product to the service need to own it.
Once you have identified trending issues and cross-validated them with your customers, the next step that comes in is allocating the issues to the concerned departments and working on the insights to curate an efficient action plan.
To get a clearer picture, it is important for the teams to have regular meetings on a fortnightly or monthly basis where you can discuss data from all the VOC sources like:
- Survey Responses
- Customer Call Data
- Support Call Data
- Social Mentions
And work on creating a roadmap that is multifaceted and has both long-term and short-term strategies.
Now that you know who will take action on which complaints, it’s time to generate ideas and prioritize them to have the best impact.
Step 5. Take Action on the Customer Issues
You’ll identify loads of complaints. But when you’re growing as a business you don’t have the resources of Netflix or Amazon. You’d have to prioritize everything.
So, for creating an action plan, prioritize the results of the verbatim analysis to select the order in which you will be resolving the customer issues.
Prioritization depends on multiple factors:
-
Number of customers impacted
You need to look into how many customers will be impacted by a particular action in a given period and how it will impact customers as an individual.
Example: Customers per quarter, transactions per month, etc.
-
Impact on the business metrics
With the impact of the number of customers involved, it is important to assess the impact it will have on the business metrics such as retention, acquisition, churn rate, etc. And also, how that will affect the timelines.
-
Effort required by the team
Some tasks may require an individual’s effort while others will involve the entire team.
This makes it important to understand the existing workload on the team – what tasks are they working on, what tasks can be pushed to a later stage, etc. It helps them take important issues in hand and build better experiences for the customers.
Collating all the above factors will help in creating an action plan that will drive best results in a lesser period, without exhausting resources, and without affecting other timelines.
There are a couple of other frameworks that you can use for prioritization like:
The next most important but often ignored step is COMMUNICATION.
It is important to communicate with your customers that not only your brand is listening to them, but it is responding.
Let them know their insights are valuable enough to drive a change.
How can you do that?
How to communicate with your customers in B2B and B2C?
In the case of B2B brands, you can
- Personally contact them via email, message, or a call
- Incorporate updates in product newsletters
In the case of B2C, you can
- Inform the update in the next survey
- Run a marketing campaign and share it with the world
- Incorporate updates in product newsletters
Step 6. At last, Measure the Impact of your Actions
After taking action on your customer feedback, if your customers are significantly getting happier and more satisfied with the brand experience, it will reflect in your NPS surveys.
You can validate this by checking
- Increase in the NPS number
- Decrease in tag occurrences
- Better customer sentiment around those tags
- and the ultimate goal- Increased ROI (Referrals, Acquisition, retention whatever metric is the department goal)
Customers expect more from brands and services – faster, more personalized responses. It’s going that extra mile that can help you build more loyal fans.
So, next time when you sit down to analyze your NPS verbatim, do follow these 6 important but insanely easy steps. Once that’s done, the success rate of your NPS program is going to improve drastically. We can totally vouch for it!
TIP: All of this can be done by an efficient NPS software . It helps you create NPS surveys and launch them at the right touchpoint and at the right time. Also, the tool helps share alerts to the team when a detractor shares their feedback and analyzes all the feedback. Not only it’ll help you close the loop in time, but it will also help you create an efficient NPS program.
Here’s a list of top NPS tools that can help you achieve the same.


