
A good NPS score is all relative.
The true value of NPS data comes from identifying trends, themes, etc, rather than evaluating each individual score. Therefore, rather than focusing on the universal number, it is imperative to compare NPS scores over time to gain a better understanding of your NPS program and identify recurring themes and pain points.
However, that’s not all.
Along with comparing their own NPS scores over time, businesses should also evaluate their NPS score relative to industry standards and competitors to determine what’s “good” for them.
Keeping that in mind, let’s explore the NPS scores of different industries to determine where you stand.
Exploring NPS Scores in the B2B Domain
After working over 10 years in the CX industry and interacting with different brands in the B2B sector, I have compiled a list of some industries in the B2B sector that are prominent across the world. You can expect the average NPS score by company.
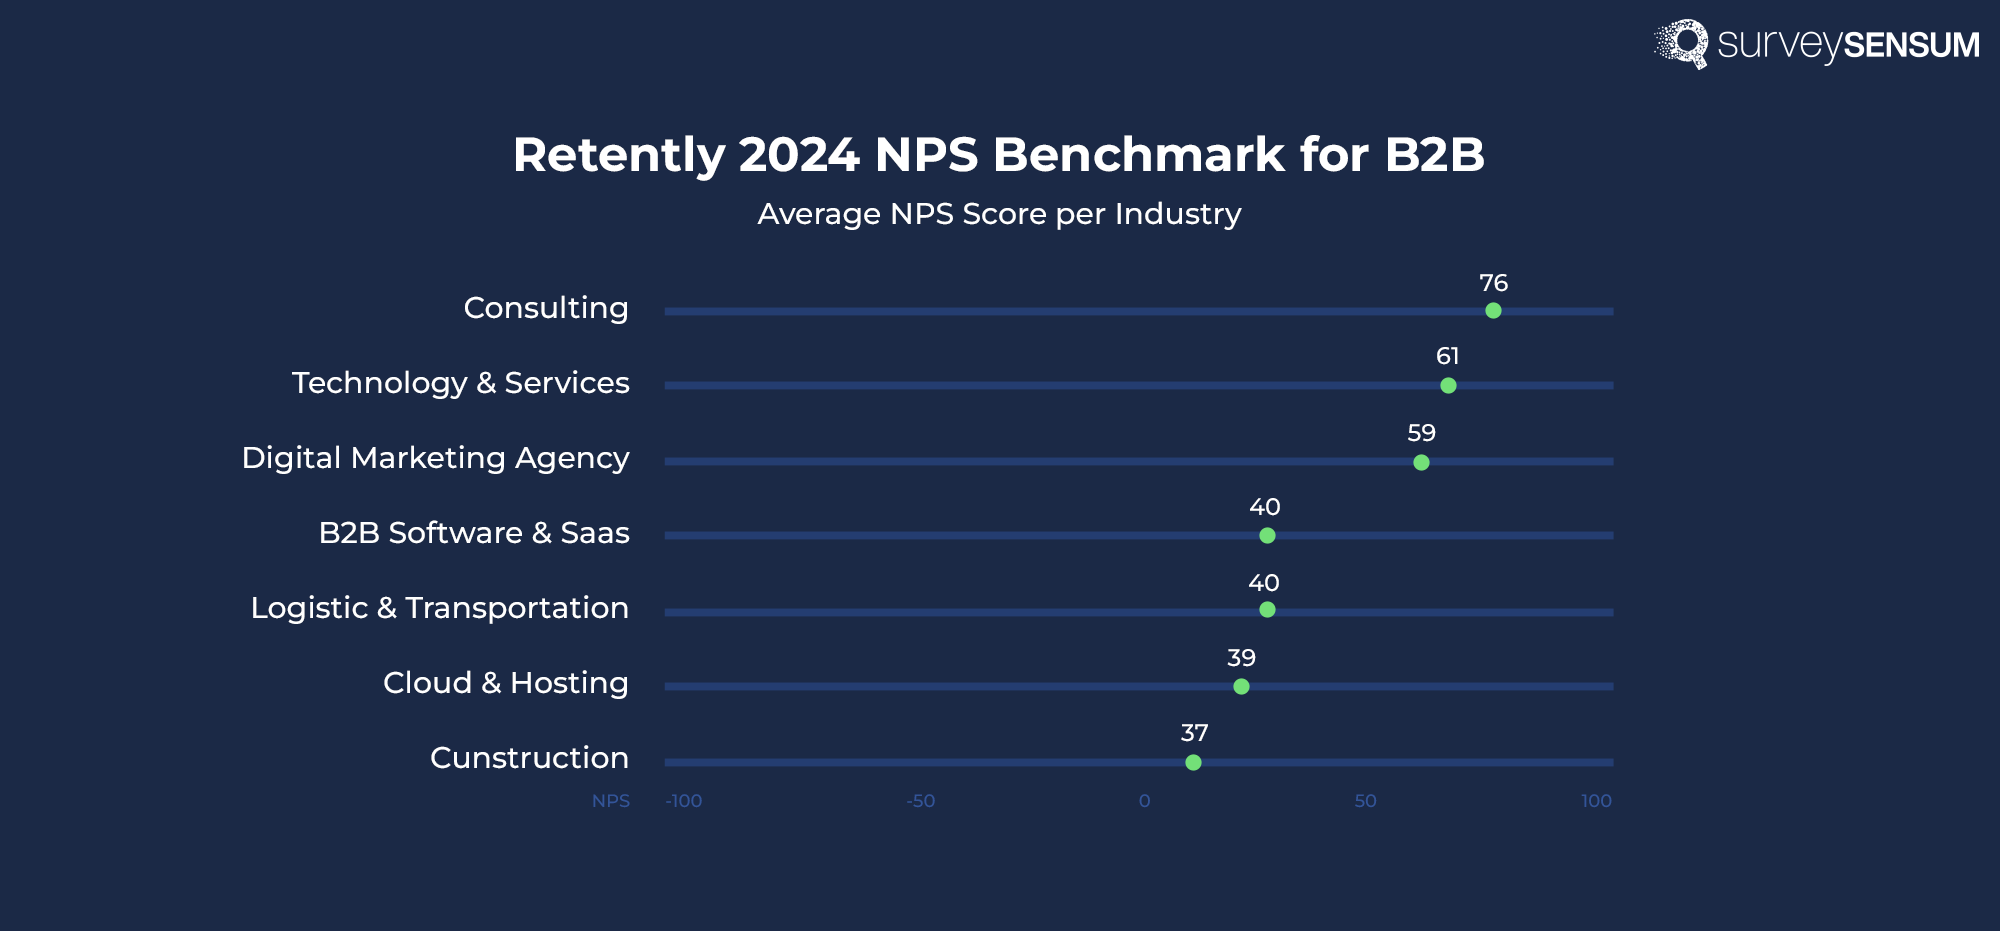
Here’s a quick overview of the various industries and the scores.
In Consulting
Average NPS score – 76
There is a reason why consulting is at the top of the list of average NPS scores by industry. Consulting firms work closely with their clients and ergo result in building a strong rapport with them. This coupled with the fact that they provide quality service results in customer satisfaction. Thus, the average NPS score is 76.
In Technology & Services
Average NPS score – 61
This sector is quite wide, and the businesses provide a wide range of services – from IT support to software development, including AI development services. These companies are often known for their innovative and customer-centric approach, making way for the average NPS score of 61. Another reason for the high NPS score is their responsiveness, which makes the clients feel valued.
In Digital Marketing Agency
Average NPS score – 59
Digital marketing services vary, but (in most cases) the goal remains the same – leads. With tried and trusted and innovative strategies, digital marketing agencies hold the reins here. By successfully promoting client products (or services) through different channels these agencies reach their goal, leading to increased satisfaction. Hence, a NPS score of 59.
In Logistics & Transportation
Average NPS score – 40
In Logistics and transportation, customers heavily rely on the timely delivery and quality of services. Any issue with services or delays in issue resolution could lower customer satisfaction. However, not every issue can be sorted out promptly and might result in dissatisfaction. Even though this is the case, the NPS score of 40 has stayed the same for 2024.
In Software & SaaS
Average NPS score – 40
SaaS and the Software industry can include anything from productivity tools to enterprise software. While customers are often satisfied with the software they have there are some factors that hinder this. These factors include but are not limited to software pricing, functionality, and performance. Even though this is the case, the NPS score of 40 has stayed the same for 2024.
In Cloud & Hosting
Average NPS score – 39
Cloud and hosting should be one industry that has seen a tremendous increase in the average NPS score. Previously (last year – 2023) the score hovered over 25, but it has now reached 39. This shows how dedicated the companies have been to ensuring higher customer satisfaction.
Gather, Measure and Benchmark your NPS Score Against your Industry’s with SurveySensum
In Construction
Average NPS score – 37
Construction is one of the most challenging ones on the list. Building a complex structure to perfection within the agreed-upon time and resources while battling several factors which include climate, quality of work, cost overrun, and so on. All these could be the reason why the average NPS score lowered from 45 (2023) to 37.
Exploring the NPS Scores in B2C Domain
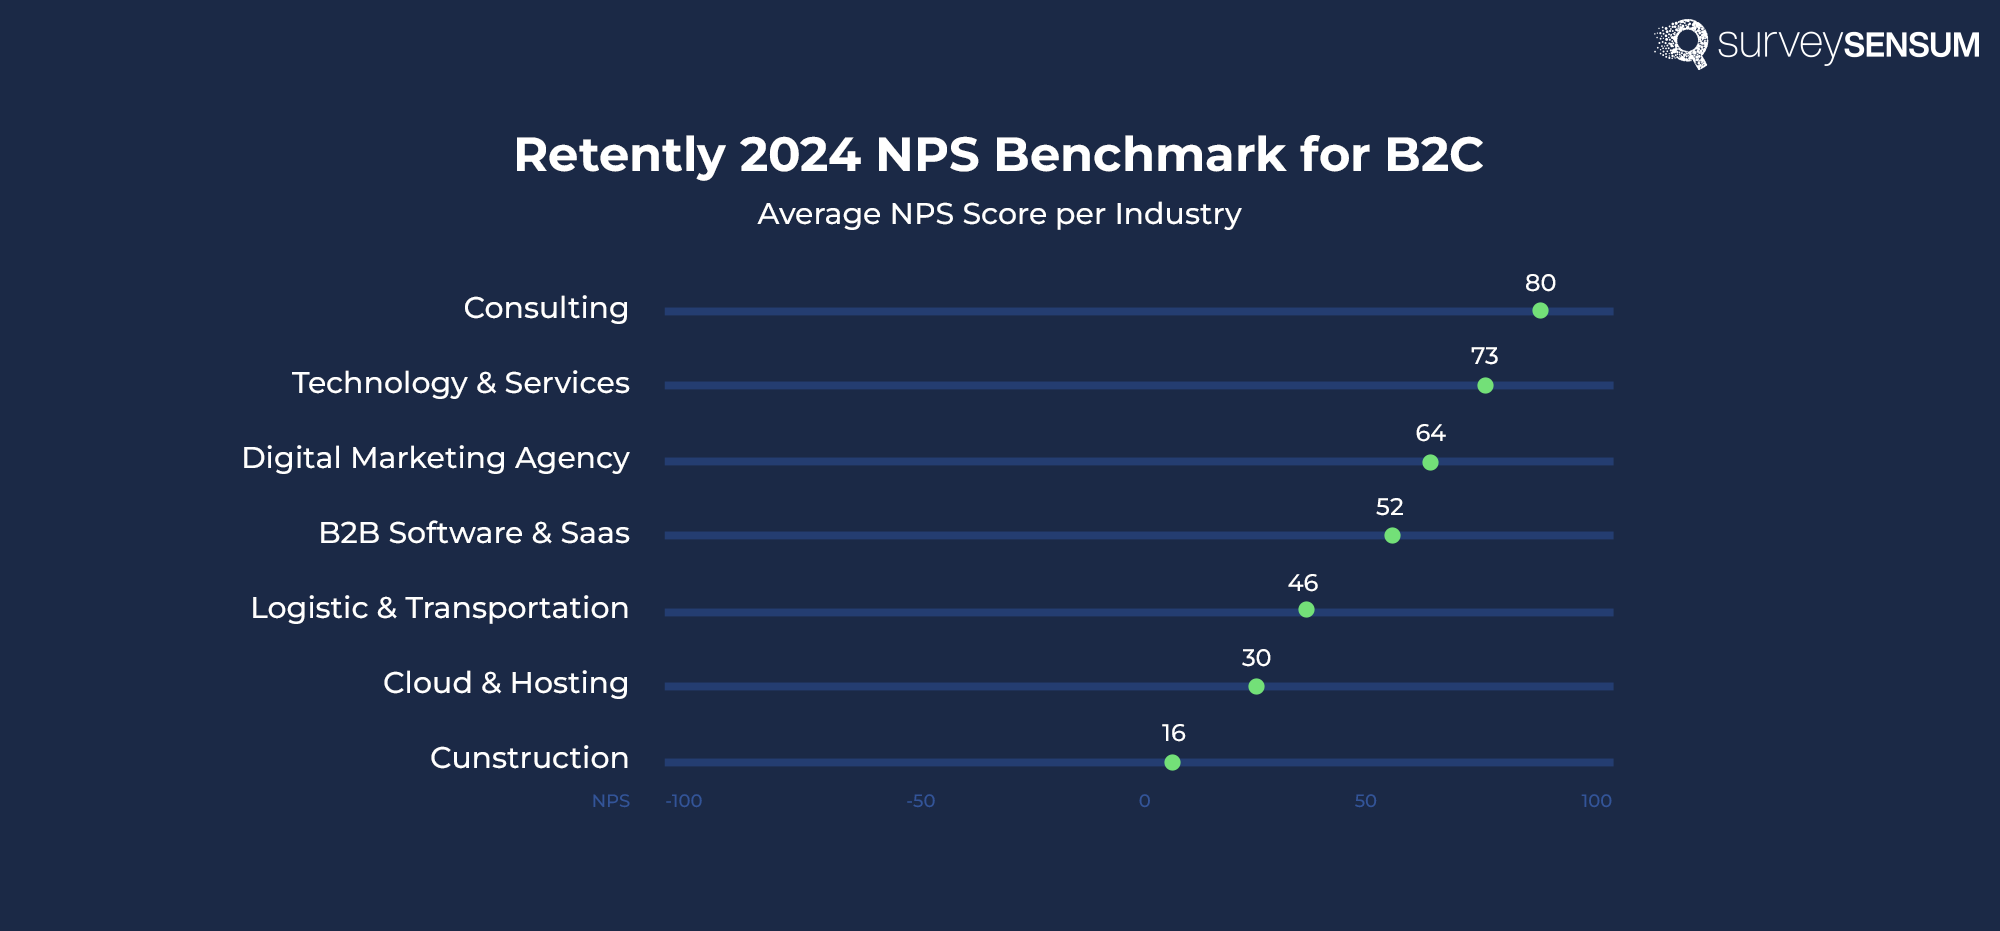
Now, let’s have a look at the different industries within the B2C domain. Similar to B2B, there have been changes in average scores here as well.
In Insurance
Average NPS score – 80
Insurance topped the list last – 2023 – with 71. In 2024, the industry still holds a high ground and even increased the average score to 80.
These institutions often require a high level of security and transparency in their operations. Together with the personalized service these institutions offer, they could significantly improve their customer satisfaction and loyalty. And this could be the reason for the hike in NPS score.
In E-commerce
Average NPS score – 52
E-commerce has seen a drastic drop in NPS scores. They had a score of 62 in 2023, but has now dropped to 52. The reason could be increased online fraud across online platforms, diminishing product quality, or even the pricing.
In Retail
Average NPS score – 64
The average NPS score of retail in 2023 was 61. In comparison, there’s been a slight increase this year to 64. Retailers focusing more on creating positive in-store experiences could be one reason for this hike, especially when supported by the right top NPS tools for retail to measure loyalty across channels. Also, it should be noted that established brands often enjoy high customer loyalty, which also contributes to positive NPS scores.
Retail brands with high NPS scores.
- Pharmacy: Local independent pharmacies (52)
- Convenience: Amazon (55)
- Grocery: H-E-B (71)
- Home Improvement: Sherwin Williams (48)
In Healthcare
Average NPS score – 46
Healthcare is another industry where the average score has seen a surge. From 38, in 2023, it had climbed to 46 in 2024. It’s a sign that healthcare organizations have finally understood the importance of improving patient experience and overall satisfaction. And more importantly, they are trying to provide the best experience possible. Doing something simple like adopting automation tools to schedule appointments or using small practice EMR solutions to collect and store patient data can significantly improve patient experience.
In Communications & Media
Average NPS score – 30
The score is more or less the same in communication. In 2023, it was 29, and now, in 2024, it’s 30. The reason could be the characteristics of the service. Issues such as service outages or poor connectivity can lead to customer frustration, even if the issues are sorted at the earliest. Still, the slight increase implies how diligently the companies are working to make sure the customers are satisfied.
Here are some companies and their respective NPS scores.
- Mobile: MintMobile and Consumer Cellular (62)
- Internet: T-Mobile (32)
- Video: YouTube TV (46)
In Internet Software & Services
Average NPS score – 16
Internet software and services had one of the lowest average NPS scores in 2023 which was 4. However, it has now climbed up to 16 in 2024. There is improvement, which is a good sign. If you are someone in the US, you will know how tedious the internet service and connectivity can be. Not to mention the service cost. All these could mount up to reason for the lower NPS score.
Analyze Your NPS Score and Make Actionable Decisions with SurveySensum
Measure, Analyze, and Act on the NPS Score with SurveySensum
Simply calculating the NPS score is not enough – you need to act on it. It’s all about understanding where you have gone wrong and how you can resolve them.
This is where NPS software like SurveySensum comes into play.
SurveySensum is more than an NPS software. It is an AI-enabled end-to-end CX solution that enables you to close the feedback loop and make informed decisions with meticulously crafted NPS surveys and advanced AI-driven text analytics.
This NPS tool has it all to help you run a successful NPS program
- Pre-built Survey Template
- Multilingual surveys
- Multiple survey distribution channels
- AI-powered Text Analysis Software
- Robust Report
- Role-based Dashboard
- CX Expert Consultation
And the best part? All these are part of pricing plans designed to fit your budget!


