Your NPS score is at an all-time high and you just onboarded a new client with the power of positive word-of-mouth from one of the satisfied customers.
Well, this is the power of NPS. Not only does it help you build strong relationships with your customers, it significantly boosts your company’s growth.
However, not all loyal customers actively endorse your products
— making it crucial to delve deeper into your NPS data.
While your NPS program brings back a variety of quantitative and qualitative data, what really matters is how you understand the data and bring it to use.
And that’s where NPS reports come into the picture.
NPS reports are one of the most efficient ways of organizing NPS data that every team in your organization can easily understand.
And there is no better tool than robust NPS software to create these intuitive reports!
First, let’s understand NPS reports.
What is an NPS Report?
An NPS survey report is a detailed analysis that dissects the outcomes of your NPS survey, focusing on both the quantitative and qualitative insights gathered from NPS surveys.
→ It basically offers a visual representation of how your NPS program is performing.
The report encompasses various elements tailored to meet your organization’s specific objectives. These elements include the distribution of respondents across NPS categories (Promoters, Passives, Detractors), trends over time, actionable recommendations, and comparisons with industry benchmarks or competitors’ NPS scores, etc.
By customizing the content and format of the NPS report to align with organizational goals and presenting it in a clear and impactful manner, you can leverage the insights gained from the NPS survey to drive strategic decisions and improve customer satisfaction and loyalty.
Now, let’s explore the types of NPS reports and the functions that they serve.
Different Types of NPS Report Examples for 2025
There are several types of NPS survey reports that organizations can create to analyze customer feedback and track Net Promoter Scores effectively. Here are some examples of different types of NPS reports:
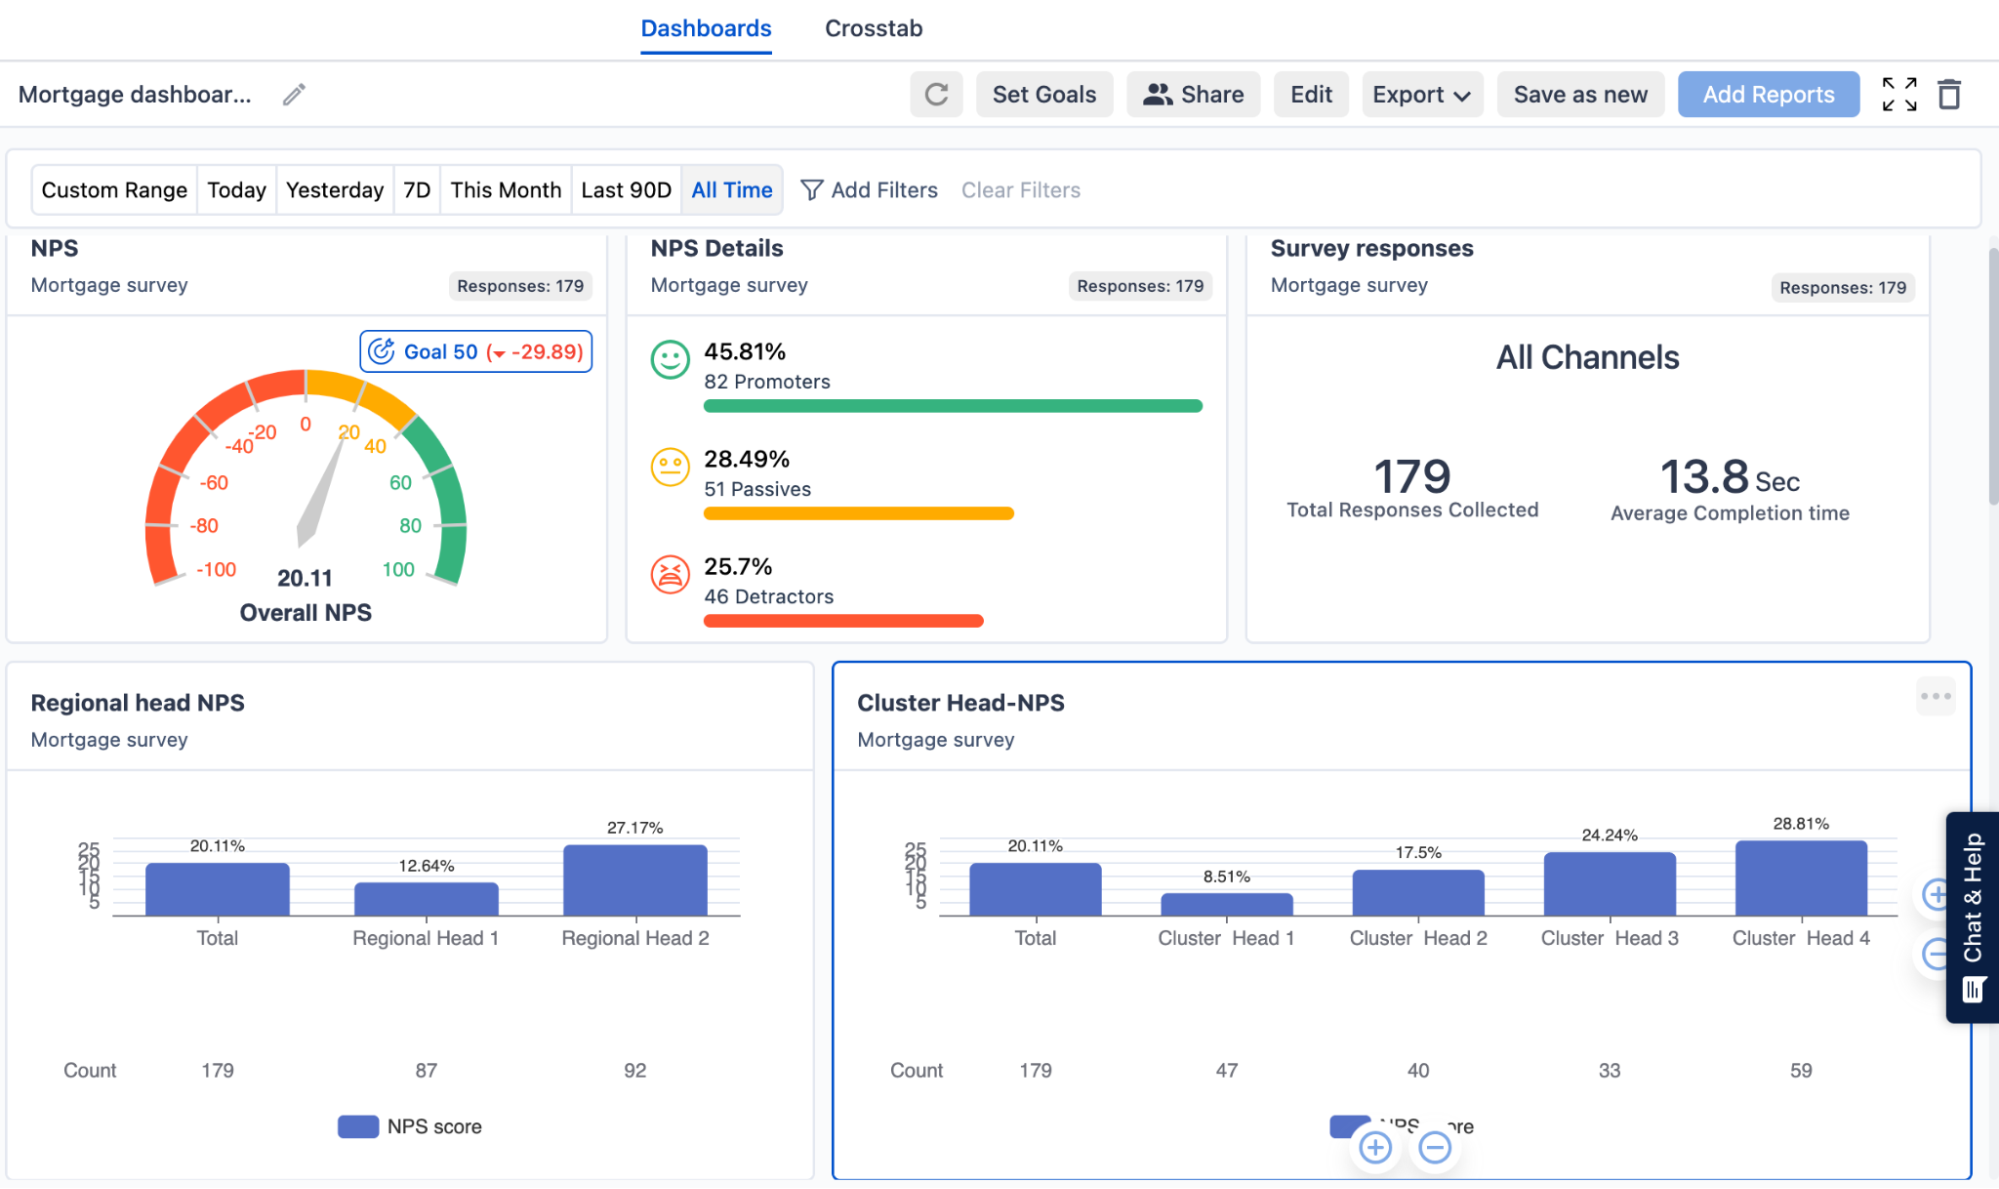
1. Numerical Report
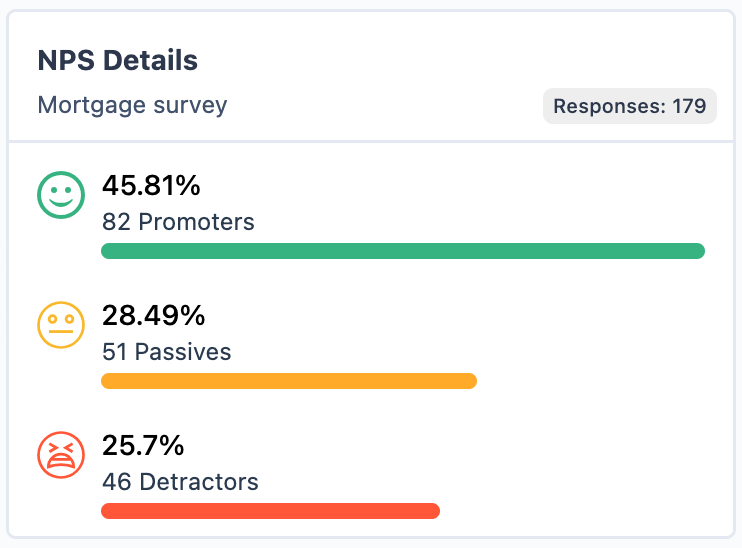
This report provides a numerical breakdown of the NPS program along with the percentages of Promoters, Passives, and Detractors. It typically includes the formula used for calculating the NPS and also includes Net Promoter Score benchmarks or targets for comparison purposes.
2. Word Cloud
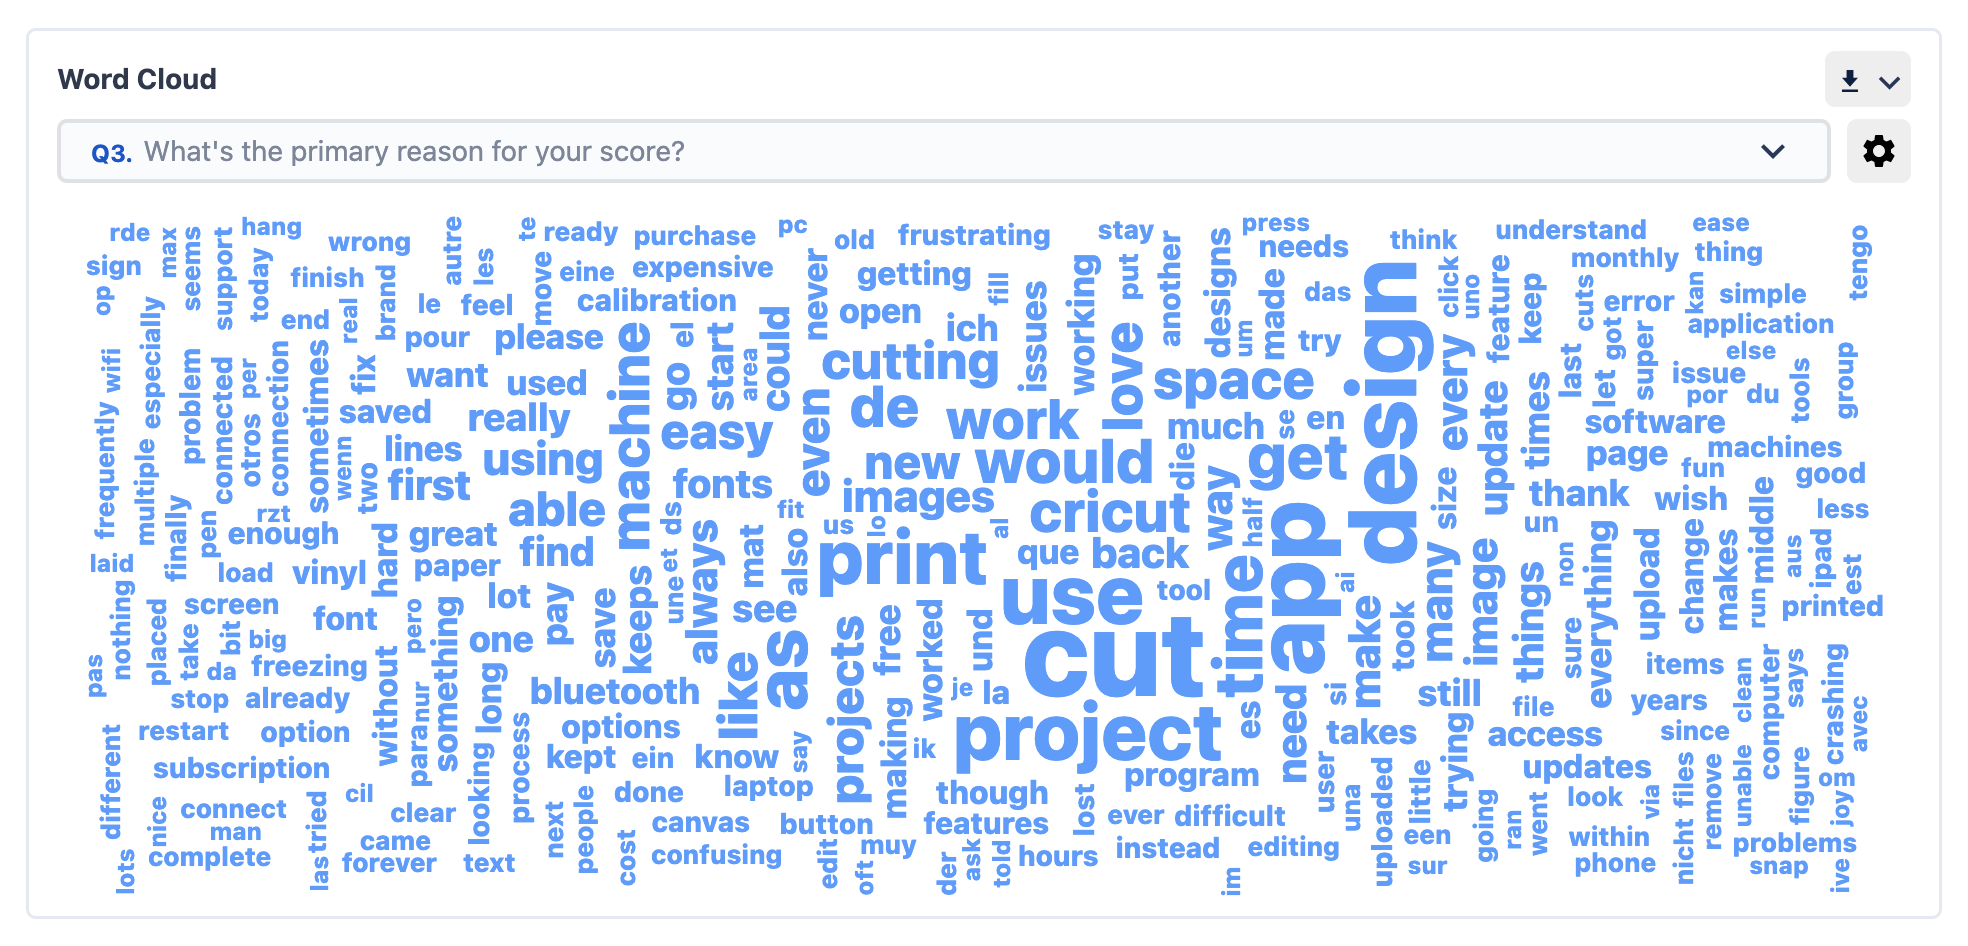
The word cloud report presents a visual representation of the most commonly used words or phrases from the open-ended responses in the NPS survey. Words are sized based on their frequency, allowing you to quickly identify common areas of concern mentioned by customers.
3. Text and Sentiment Analysis
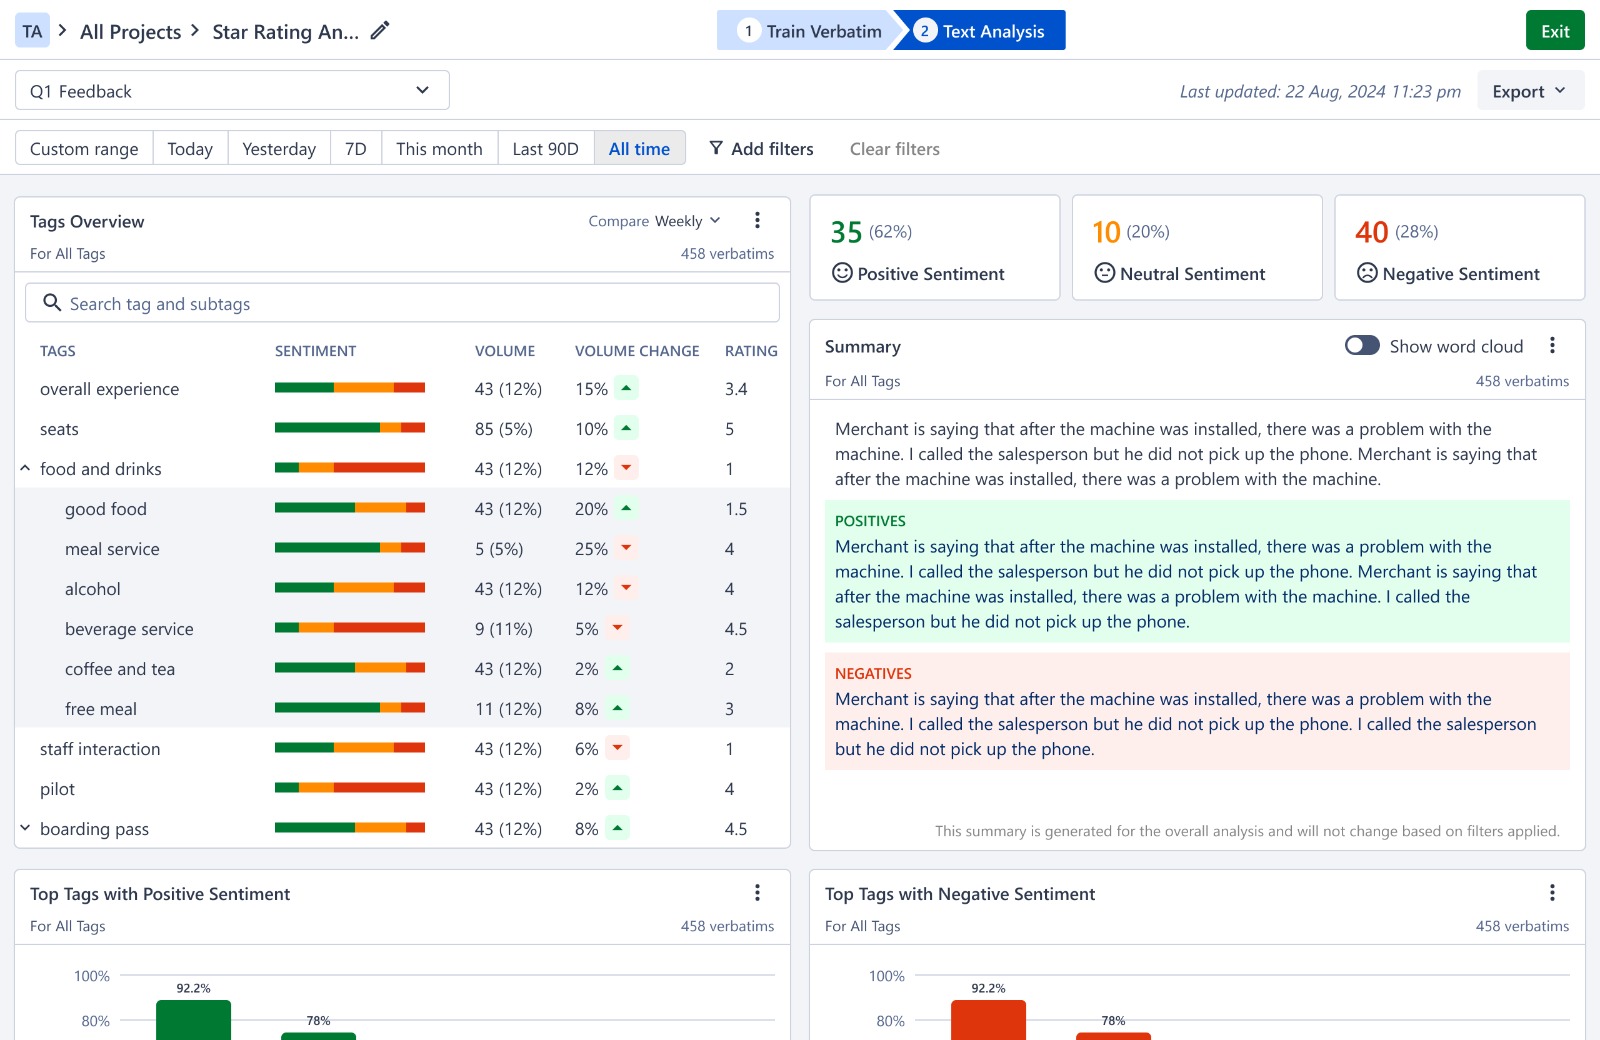
This report dives deeper into the qualitative data by conducting a text and sentiment analysis of the open-ended responses. Text analysis categorizes responses into different themes or topics, such as product quality, customer service, etc., while sentiment analysis evaluates the sentiment (positive, negative, neutral) associated with each topic, offering insights into areas where customers are particularly satisfied or dissatisfied.
4. Trends Over Time – Historical NPS
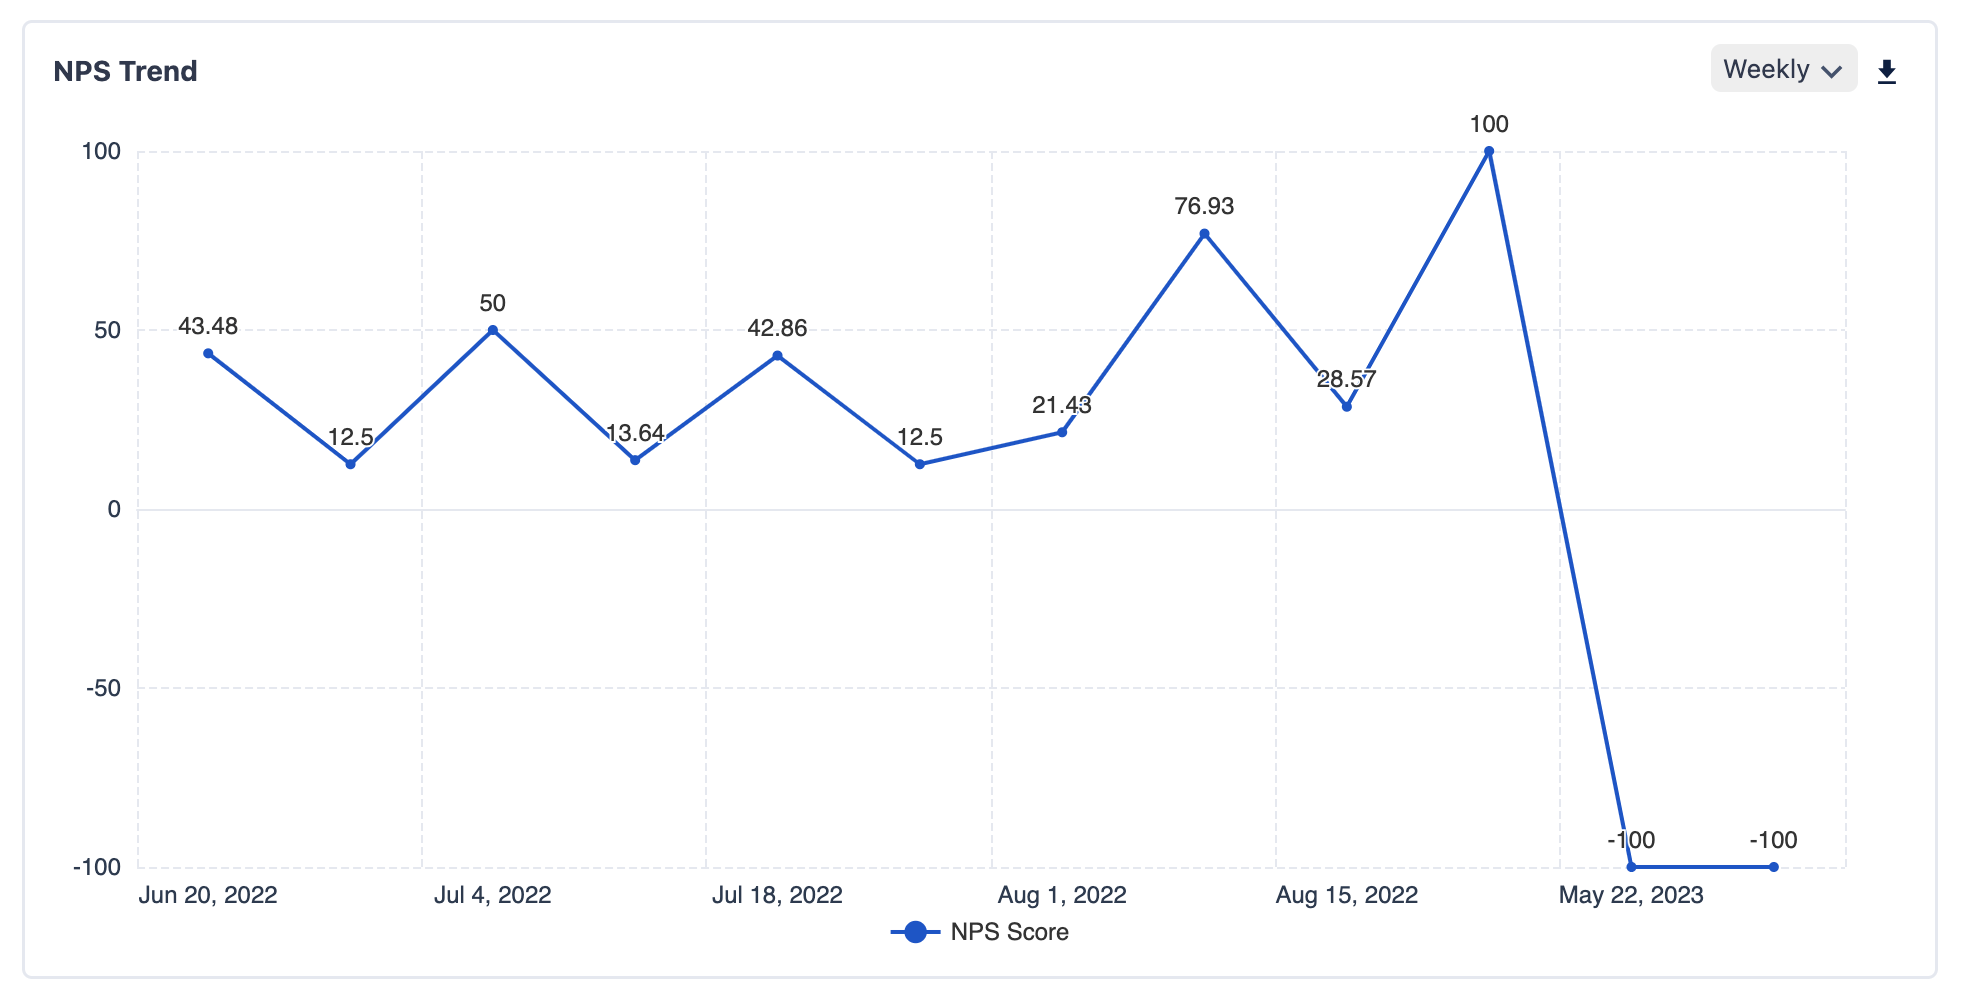
The historical NPS report tracks NPS scores over time, presenting trends and patterns in customer loyalty and satisfaction. Analyzing historical NPS data helps in understanding long-term trends and evaluating the effectiveness of strategies implemented to enhance customer experience.
5. Bar Chart
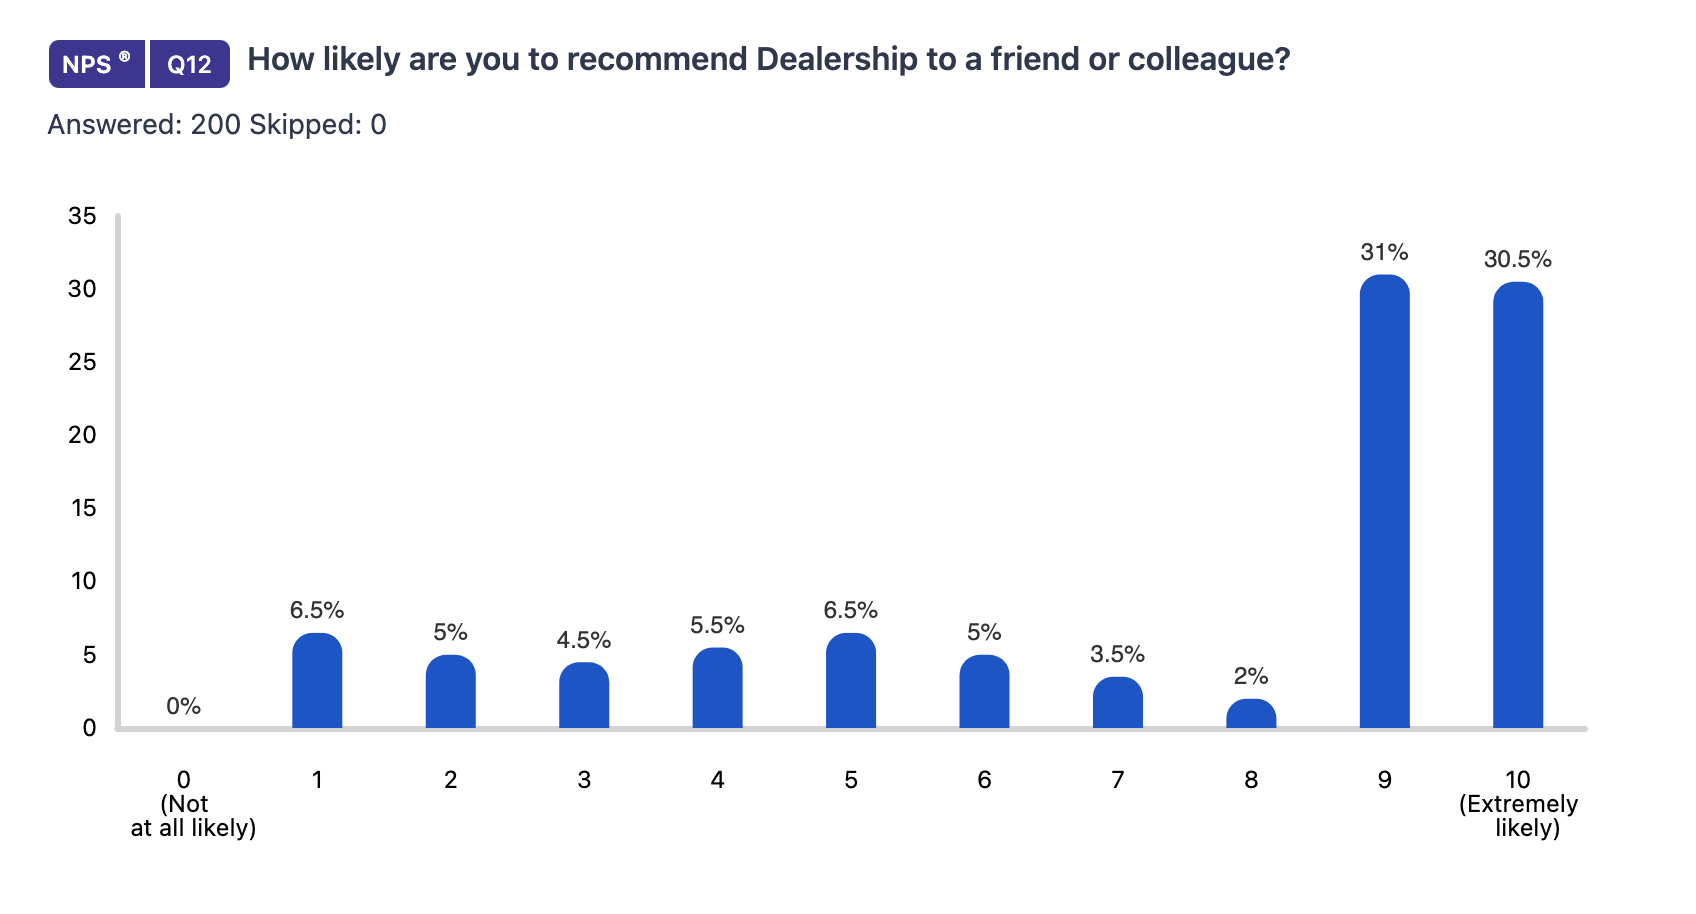
The bar chart report provides a comparative view of NPS scores across different customer segments, product lines, geographic regions, etc. By presenting NPS scores in a bar chart format, you can easily compare performance metrics and identify areas of strength or areas that require attention.
Each of these elements contributes to a comprehensive NPS report that combines quantitative metrics with qualitative insights, providing a holistic view of customer loyalty, satisfaction levels, and actionable recommendations for enhancing the customer experience.
Get real-time, AI-powered reports with SurveySensum that transform your NPS survey responses into actionable insights – all in just a few clicks!
Free Forever • No Feature Limitation • No Credit Card Required • Sign Up For Free ![]()
6. Heatmaps
Heatmaps are data visualization tools that use color gradients to represent and analyze data intensity or performance in a specific area. In the context of NPS or customer experience, heatmaps provide a visual overview of NPS scores or customer feedback across different segments, such as geographical regions, important customer touchpoints, different departments or teams, different stages in the customer journey, etc.
It provides a clear, visual way to present data to stakeholders, making it easier to drive actionable insights and help focus time, effort, and resources on areas with the greatest opportunity for improvement.
Now, these are the different types of NPS reports but what about which one is the best for your business requirements and NPS goals? Let’s find out.
Choosing the Right NPS Report for Your Organizational Goals
When selecting an NPS report, it’s essential to align the format with your organizational needs and goals. Different reports provide unique insights, so understanding their strengths and applications can help you make the right decision. Below is a comparison of NPS report types and their best use cases.
| NPS Report Type | Best For | Used For |
| Numerical Report |
|
|
| Word Cloud |
|
|
| Text and Sentiment Analysis |
|
|
| Trends Over Time |
|
|
| Bar Chart |
|
|
| Heatmaps |
|
|
What Are The Benefits Of Creating An NPS Report?
Creating an NPS report offers several benefits for organizations looking to understand and improve customer satisfaction and loyalty. Some of the key benefits of creating an NPS report include:
- Identifying Promoters and Detractors: The NPS report categorizes customers into Promoters, Passives, and Detractors. This segmentation helps identify advocates who can drive positive word-of-mouth and detractors who may be at risk of churning, allowing organizations to prioritize efforts to retain and delight customers.
- Understanding Customer Feedback: In addition to the numerical NPS score, the report includes qualitative feedback from open-ended survey questions. This feedback provides valuable insights into the reasons behind customers’ ratings, their experiences, pain points, and suggestions for improvement.
- Benchmarking Performance: NPS reports allow organizations to benchmark their performance against industry standards, competitors, or previous periods. Comparing NPS scores and trends helps identify areas of strength and areas for improvement, leading to more informed decision-making.
- Driving Continuous Improvement: The insights gained from an NPS report enable organizations to identify trends, patterns, and actionable recommendations for enhancing customer experience. By addressing feedback and implementing changes based on customer insights, organizations can drive continuous improvement and enhance customer satisfaction and loyalty over time.
- Enhancing Customer Retention: By proactively addressing issues highlighted in the NPS report and focusing on improving customer satisfaction, organizations can reduce customer churn and improve customer retention rates. Satisfied and loyal customers are more likely to continue doing business with the company and become brand advocates.
- Informing Strategic Decision-Making: NPS reports provide senior management and decision-makers with valuable data and insights to inform strategic planning and resource allocation. With the help of this, organizations can drive business growth, enhance competitiveness, and build strong customer relationships.
Overall, creating an NPS report enables organizations to systematically measure, analyze, and act upon customer feedback, leading to improved customer satisfaction, loyalty, and business performance.
Reap the benefits of NPS Reporting by conducting surveys and organizing data for enhanced customer satisfaction with SurveySensum!
Free Forever • No Feature Limitation • No Credit Card Required • Sign Up For Free ![]()
How To Create An NPS Report With SurveySensum?
I’ve kept it simple with 5 easy steps!
1. Launch NPS Survey
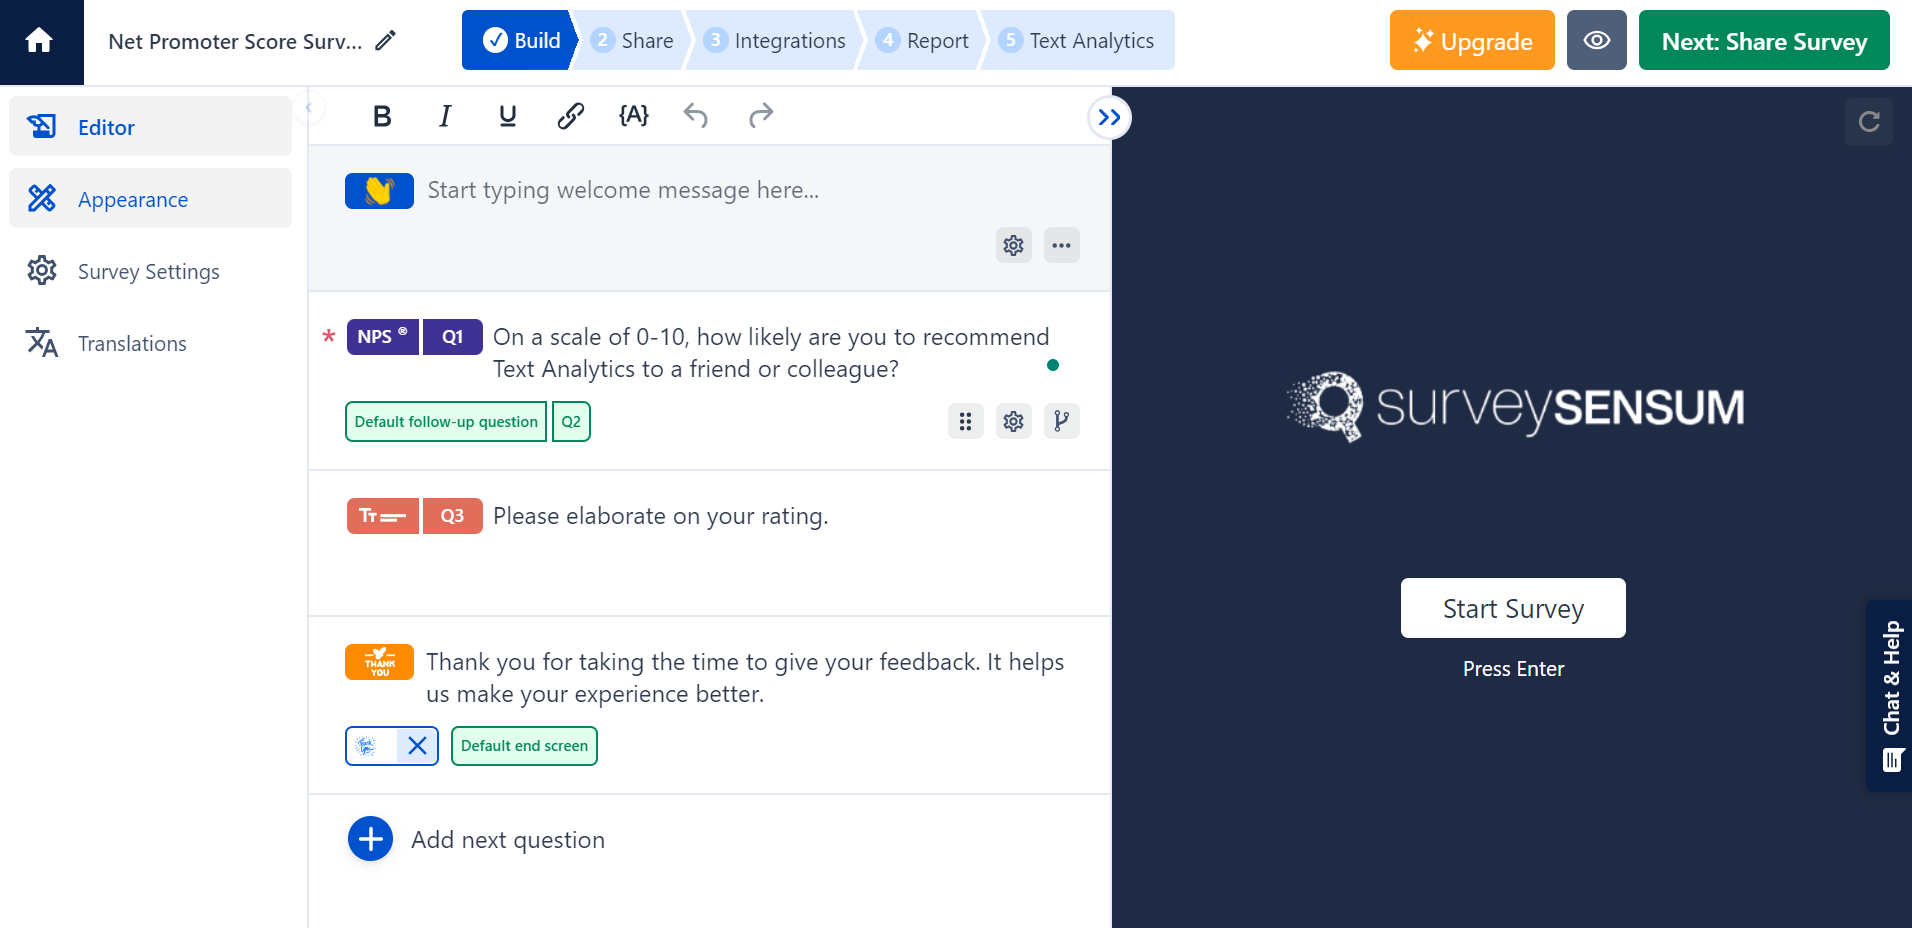
Log in to SurveySensum and create the NPS survey. All you need to do is select the NPS template and customize it to your brand colors.
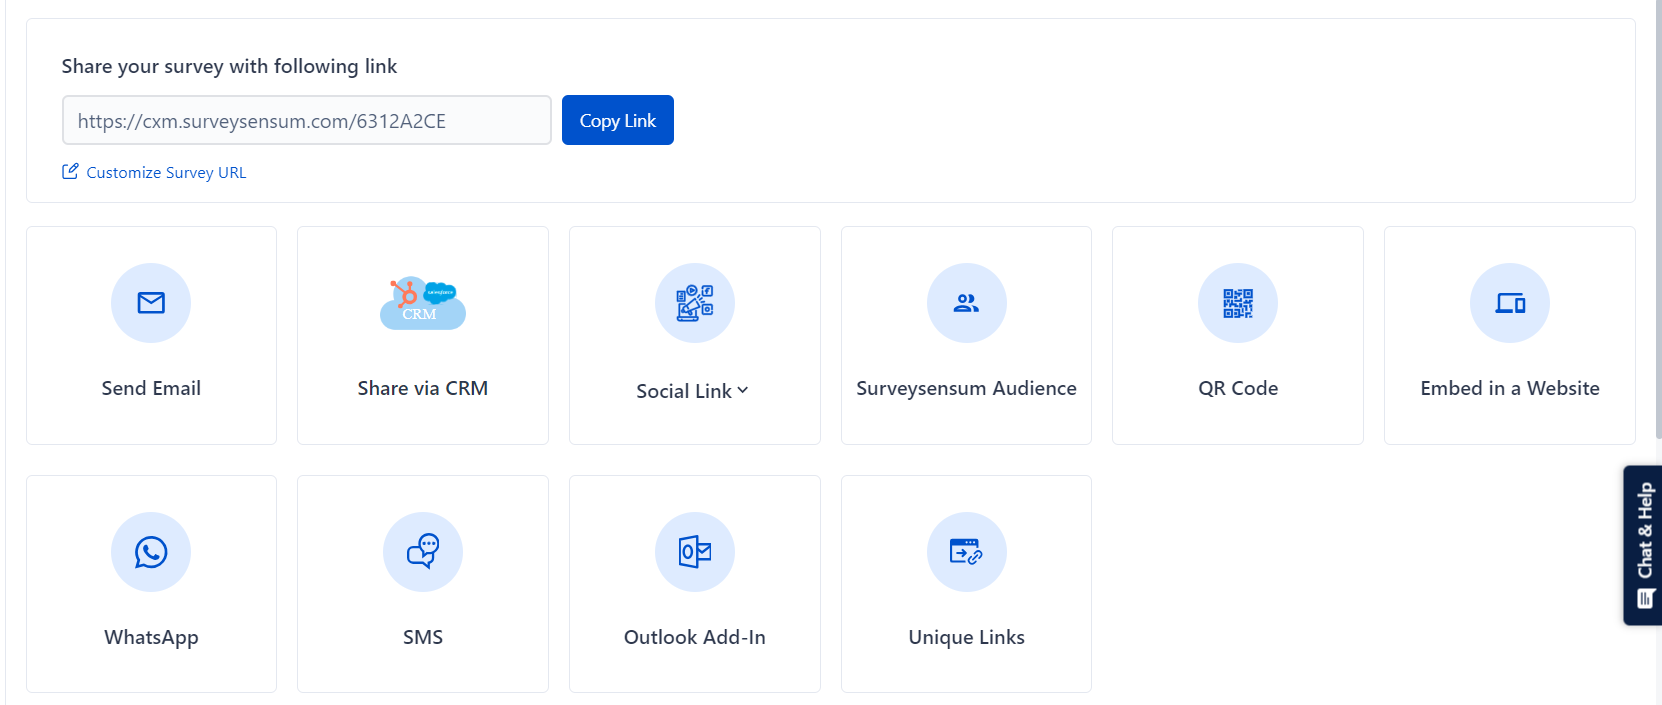
After you create your NPS survey, here’s how you can share your NPS survey it via multiple channels in a single go, click on the ‘share’ tab on your SurveySensum dashboard and select the channel.
2. Gather Responses in One Place
So, yes your customers are using multiple channels but it’s difficult to work with too many platforms. Well, let’s make it easy!
SurveySensum gathers all the responses for you through the integrated platform of your choice in one place.
All you have to do is:
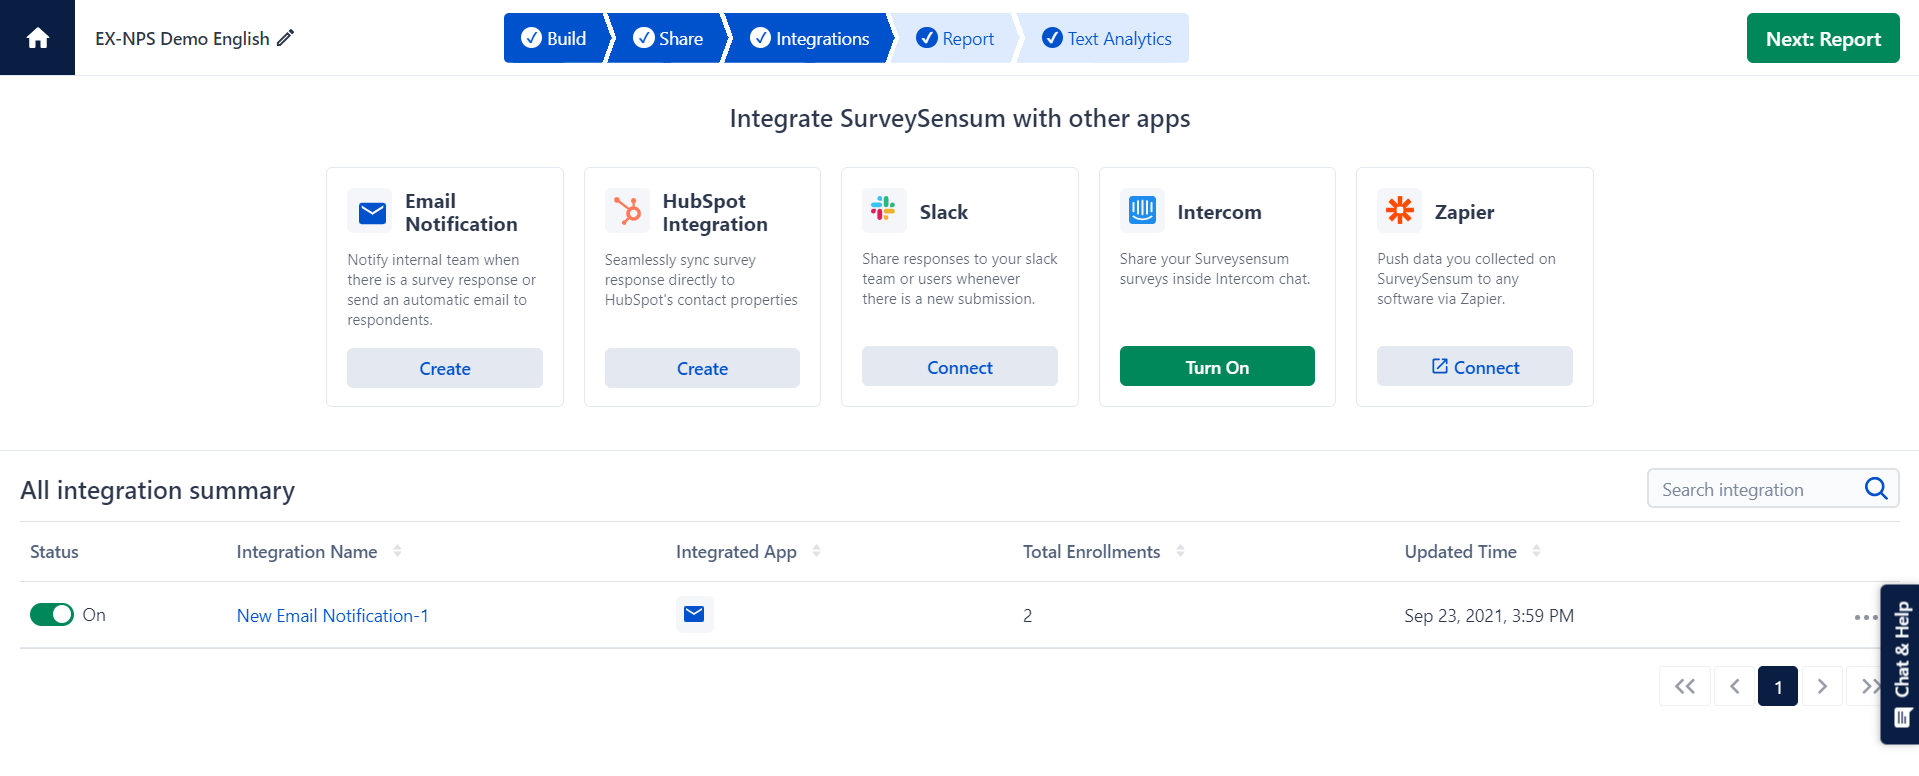
- Click on the ‘Integrations’ tab on your SurveySensum survey dashboard.
- Select your preferred platform to gather responses.
- Integrate the software with the chosen platform and streamline the process!
3. Analyze the NPS Feedback
All the feedback has started pouring, now is the time to analyze the NPS feedback. Well, SurveySensum automates the process for you.
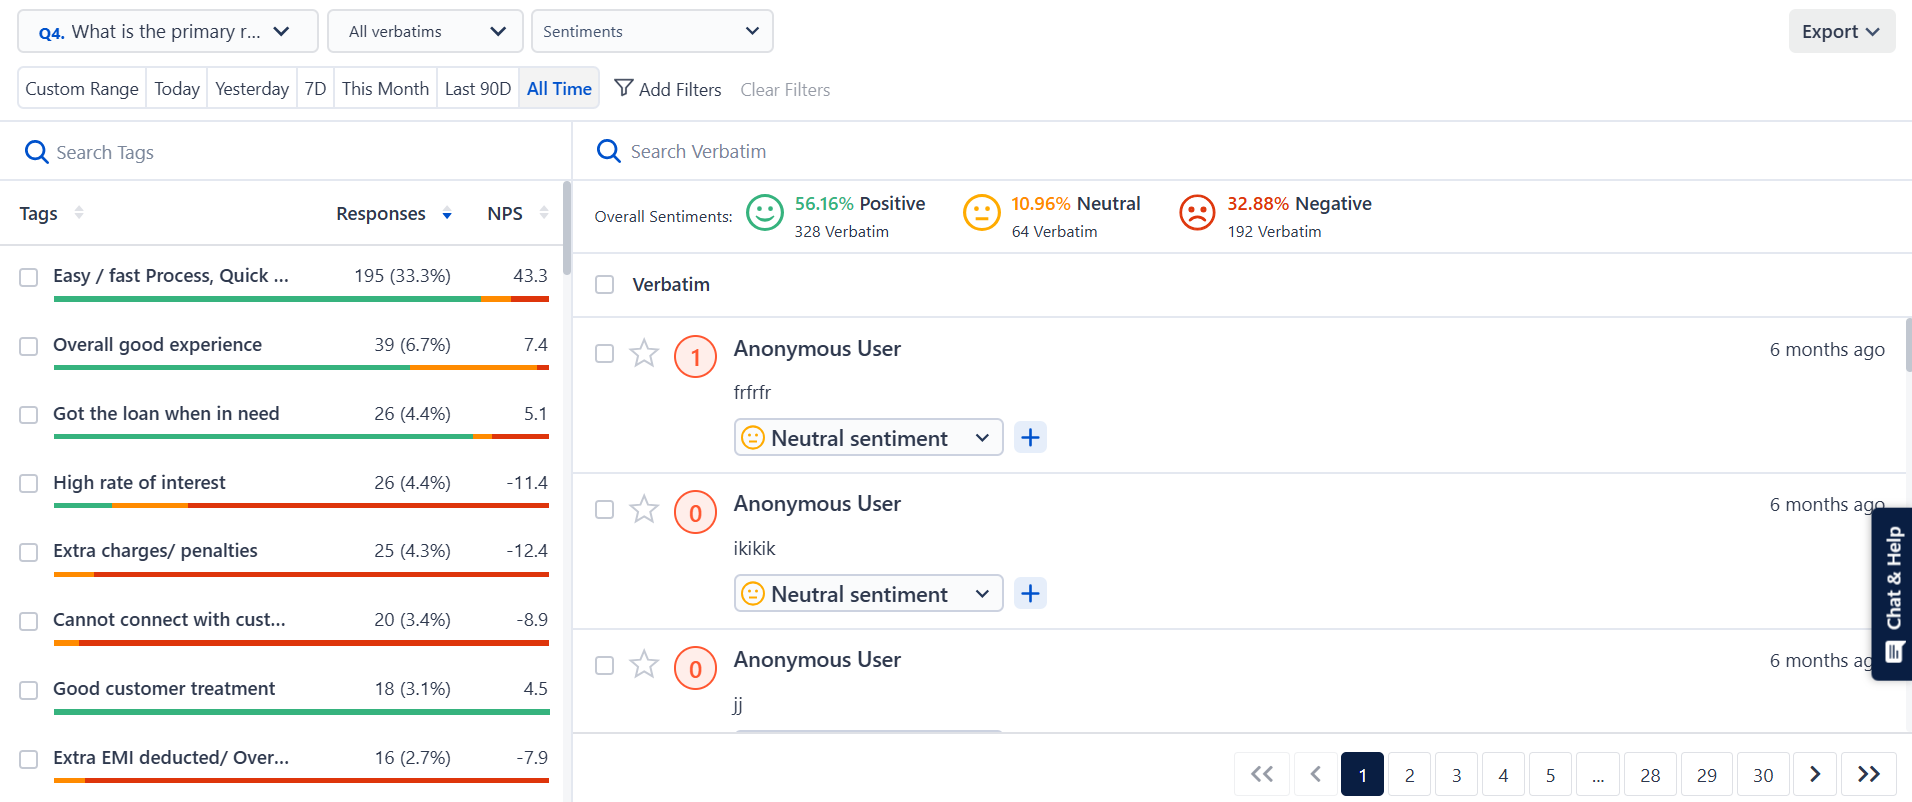
For the close-ended NPS question, it automatically calculates NPS scores based on the responses to the NPS question. And for the open-ended qualitative question, it categorizes responses into trends and sentiments with the help of AI-enabled Text Analytics.
Here’s how it works!
- The system intelligently categorizes feedback for you, reducing manual effort and ensuring accuracy. Additionally, if you want more control, you can train the AI to align with your specific goals and requirements, allowing it to tag responses based on your customized parameters.
That’s it! Now the Text analysis will automate the process with machine learning. you will see how the platform can tag every comment. This will give you a detailed report of top trends and sentiments in just a few minutes.
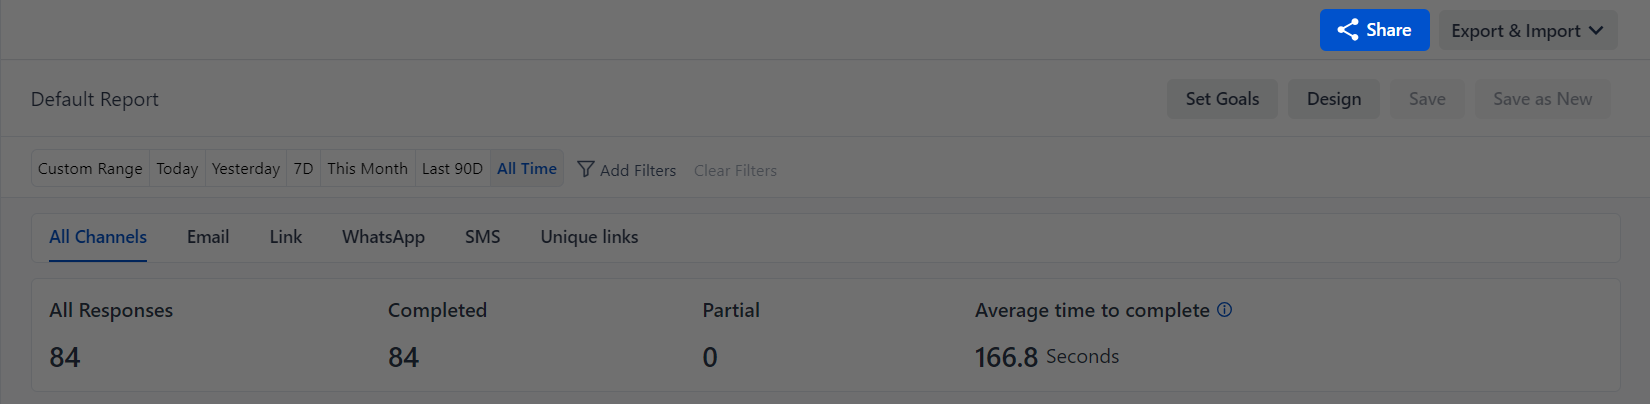
4. Generate NPS Report
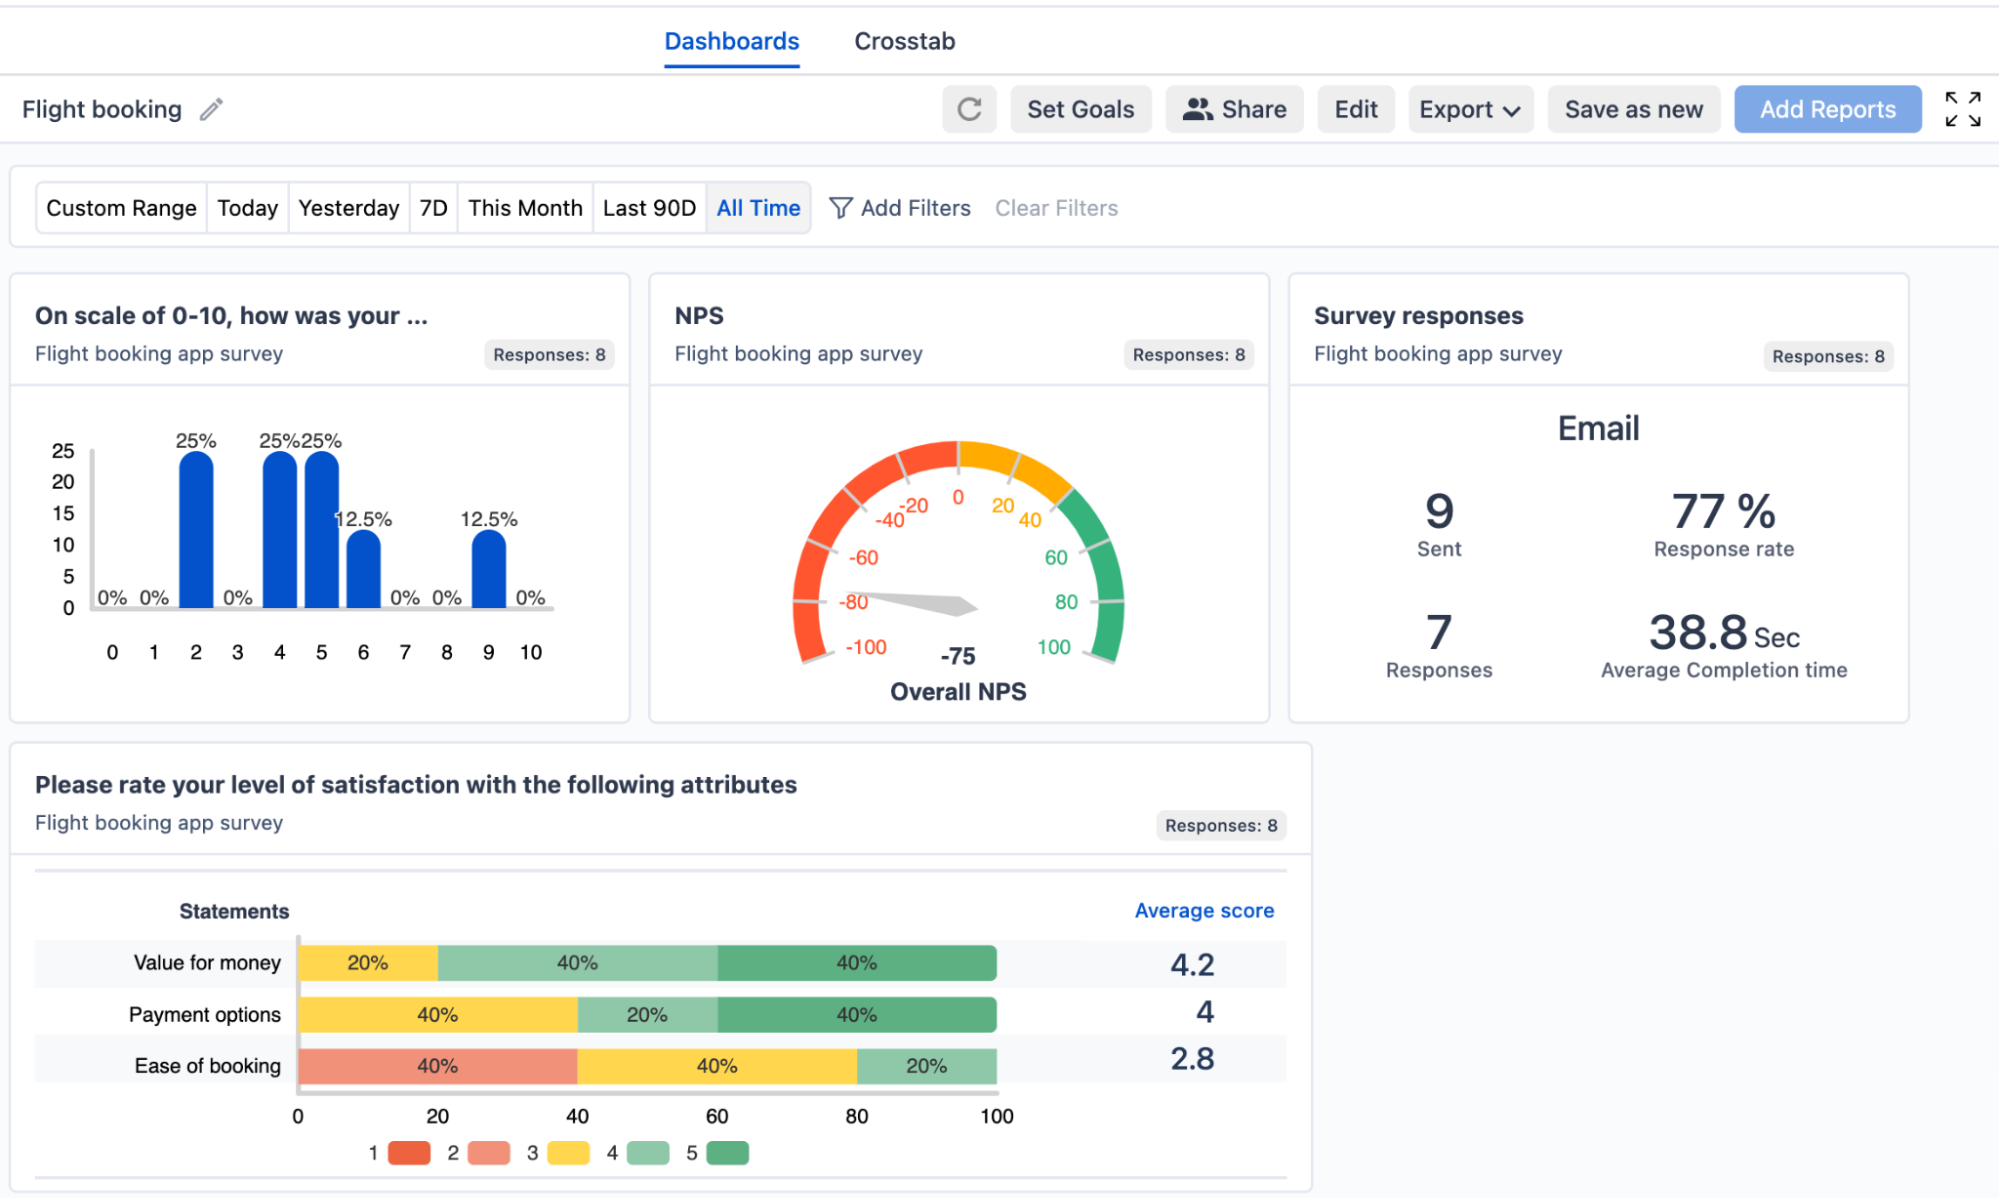
When all the customer feedback analysis is done, it’s time to get comprehensive insights from the reports. Just go to the SurveySensum Dashboard and click on the ‘Add Report’ button on the top right. Now you can generate an NPS report as you need!
Here’s how you can structure the report:
- Numerical Report: Include the overall Net Promoter Score, and percentage of Promoters, Passives, and Detractors.
- Word Cloud: Create a word cloud based on the open-ended responses to highlight common themes and sentiments.
- Text and Sentiment Analysis: Conduct a topic analysis and sentiment analysis of the qualitative feedback to identify key topics and sentiments.
- Trends Over Time: Present historical NPS trends using line graphs or area charts to visualize changes in NPS scores over different periods.
- Segmented Analysis: Analyze NPS scores across different customer segments, such as demographics, product usage, or geographic regions.
- Recommendations: Provide actionable recommendations based on the NPS data and insights gathered.
- Visualizations: Use bar charts, pie charts, and other visualizations to enhance the presentation of NPS data and make it easier to understand.
5. Customize and Share the Report
And yes, you can always customize the NPS report with your organization’s branding, colors, and logos. You can then share the report with stakeholders, such as senior management, marketing teams, and customer service departments, to drive strategic decision-making and improve customer satisfaction and loyalty.
All you have to do is:
- Click on ‘Design’ to customize your report.
- Click on ‘Share’ to generate a sharable link
- Choose ‘Export and Import’ to export it to a file of your choice.
SurveySensum offers intuitive tools and features to streamline the process of creating and analyzing NPS surveys and reports, allowing organizations to gain insights from customer feedback, take the necessary actions, and drive business growth.
Let’s now take a look at some of the best practices when it comes to creating an NPS report.
Best Practices for NPS Reporting
Creating impactful NPS reports requires careful planning, insightful analysis, and a focus on actionable outcomes. Below, we explore three key areas to enhance the effectiveness of your NPS reporting: segmenting customer data, correlating NPS with other KPIs, and avoiding some other common mistakes.
- Customer Segmentation: Customer experiences and expectations vary widely across demographics, behaviors, and interactions. Segmenting your customer data allows you to uncover trends and patterns that would otherwise remain hidden in aggregated results.
- Correlating NPS Data with Other KPIs: It offers a more holistic understanding of how customer sentiment impacts your business. NPS is not an isolated metric; it works best when integrated with key indicators like customer retention rate, revenue, customer loyalty metrics, and operational performance.
- Asking NPS Follow-up Questions: One common error is failing to ask the right NPS follow-up questions. Collecting only a numerical score without probing the reasons behind it limits your ability to identify specific areas for improvement. Including open-ended questions like, “What is the primary reason for your score?” can yield invaluable insights.
- Close the Feedback Loop: Organizations often neglect to follow up with detractors, missing the opportunity to resolve issues and rebuild trust. So, actively follow up with dissatisfied customers and communicate how you plan to address their concerns.
Gathering NPS data is only the first step in improving customer experience – the real value lies in taking meaningful action based on the insights gathered. So, let’s understand the importance and process of taking action on NPS insights.
Acting on NPS Insights
To turn NPS data into actionable strategies and improve NPS score, you must focus on prioritizing recommendations, implementing changes, and consistently monitoring progress.
- Analyze Feedback and Identify Key Issues: Start by categorizing feedback into themes such as product quality, support efficiency, or pricing. Also, focus on recurring themes or critical concerns, especially those raised by Detractors, as these often have the most significant impact on loyalty.
- Prioritize Action Plans: Evaluate the urgency and business impact of each issue. Use criteria such as the frequency of complaints, financial implications, and alignment with business goals to prioritize. For example, if multiple Detractors highlight slow customer support, addressing that should take precedence.
- Develop Actionable Plans: Break down solutions into clear, achievable steps. Create timelines for execution and define key milestones to track progress.
- Assign Responsibilities: Now, designate specific teams or individuals to own each action item and make sure you give clear ownership as it ensures accountability and avoids delays.
- Track Key CX Metrics: Measure relevant KPIs, such as customer retention, repeat purchases, or the volume of support tickets. Also, compare pre- and post-implementation NPS scores to evaluate the impact of changes.
Conclusion
Utilizing NPS reports is essential for visualizing and understanding customer feedback, empowering teams to make informed decisions, and developing strategic plans. These reports not only make complex data accessible but also serve as a foundation for driving long-term business growth through continuous NPS tracking. By consistently monitoring customer sentiment, organizations can identify trends, address issues proactively, and strengthen customer loyalty over time.
To unlock the full potential of NPS reporting, take the first step today – explore ready-to-use NPS survey templates or sign up for a demo to see the impact in action. Tools like SurveySensum simplify the process of collecting, analyzing, and presenting NPS data with features like AI-powered insights and comprehensive dashboards. By leveraging these capabilities, businesses can boost customer satisfaction, foster growth, and build lasting relationships with their customers.
Launch Your NPS Program With SurveySensum That Will Actually Work!
Free Forever • No Feature Limitation • No Credit Card Required • Sign Up For Free ![]()

Increase ROI by 3x with targeted feedback & analysis
Boost Customer Satisfaction by up to 20%
Reduce Churn by identifying pain points in real time
See it in Action
Contents
How much did you enjoy this article?