Your NPS or CSAT scores give you a snapshot of your customer sentiment, but is that enough? To stay ahead of the curve, you need to know not only what your customers think, but also why they think so.
And that calls for digging deeper into the metrics and uncovering what really influences them.
With AI-driven key driver analysis, you can move beyond intuition and pinpoint exactly what factors matter the most.
How? Scroll down!
What Is Key Driver Analysis?
Key Driver Analysis (KDA) is a technique that helps you identify and evaluate all the factors that have the biggest impact (can be positive or negative) on your outcome variable like customer satisfaction, loyalty, or brand perception.
With the help of key driver analysis, you can find out exactly which elements (like pricing, product quality, customer support) drive key CX metrics like NPS or CSAT.
For example, if your CSAT score is dropping, running a key driver analysis can help compare different factors that directly affect customer satisfaction. Thus, you’ll know if your customers love your product but find delayed customer support frustrating.
That said, let’s explore the benefits of key driver analysis.
Why Is Key Driver Analysis Important?
Here’s why key driver analysis is crucial for businesses:
1. You Get To Prioritize What Matters: Instead of spreading your resources thin by improving every single factor to drive customer satisfaction, key driver analysis highlights high-impact areas that will significantly lead to better results if focused on. For example, if the analysis reveals that customers are unhappy with slow response times, you can focus on fixing that rather than trying to improve everything at once.
2. There’s No Room For Guesswork: It’s easy to believe that you provide exceptional services when there’s no data to prove otherwise. According to Bain & Company, 80% of management teams think they offer quality customer experience, when in reality, only 8% of their customers are satisfied.
Key driver analysis eliminates this guesswork and helps you make decisions backed by real customer behavior data. For example, if you assume that customers are leaving due to pricing issues, KDA can reveal the true culprits (maybe it’s poor onboarding).
3. It Helps Enhance Customer Journey: By directly addressing the pain points and satisfaction drivers of the customers, key driver analysis gives you the opportunity to optimize touchpoints and create a good customer experience. So, if KDA shows that most customers drop off due to a confusing checkout process, you can simplify it and, in turn, improve the overall customer experience.
4. You Can Stand Out In The Market: Understanding what drives customer sentiment adds a strategic competitive edge to your business. For example, if key driver analysis reveals that your customers value sustainability as much as product quality, introducing eco-friendly initiatives will both impress your customers and set your brand apart from competitors.
5. KDA Enhances Personalization: Insights from key driver analysis can inform your marketing strategies, customer support, and even product quality to provide tailored experiences. This is crucial since 80% of customers prefer brands that offer personalized experiences. For example, you might find out that younger customers prefer chat support while the older ones prefer phone calls, and use this insight to provide tailored customer support to suit both age groups.
Let’s now understand how to execute key driver analysis effectively.
Best Practices To Perform Key Driver Analysis
Many businesses struggle with key driver analysis mainly because they don’t know where to start and which KPIs they should track. On top of that, unnecessarily complex dashboards can overwhelm businesses rather than provide meaningful insights.
To tackle this, you must approach KDA methodically. Here’s how to use key driver analysis the right way:
1. Find Out Which Factors Drive Your Outcome Variable
Begin by listing all the potential drivers like pricing, product quality, and ease of use – everything that could affect the survey results. Using a mix of historical data analysis, customer feedback, and industry benchmarks goes a long way here.
Once you have identified all the factors, use key driver analysis techniques like correlation analysis or regression to identify those few, specific factors that truly move the needle.
For example, if you want to improve your CSAT, first make a list of all the possible factors that affect customer satisfaction, like pricing, product reliability, etc. Then, analyze customer feedback with text analytics to find recurring themes. So, if multiple customers who experience slow response times also give a low score – that’s one connection between the factor and the metric (correlation analysis).
When you have identified these patterns, compare the impact of each – i.e., to what extent a factor influences the CSAT score (regression analysis). For example, product quality contributes 70% to CSAT, while response time 20%, and pricing 10%. Now, you can prioritize improvements that impact customer satisfaction the most.
SurveySensum’s AI-powered text and sentiment analysis software automatically tags and subtags feedback into relevant categories based on relevant keywords and themes. You can also train the AI models to improve accuracy and customize categorization to fit specific business needs. The AI analyzes up to 10,000 open-ended responses in just 5 seconds with 99% accuracy, allowing businesses to quickly identify key trends and sentiments without manual effort.
Numbers don’t tell the whole story – customer sentiment does. Leverage AI-driven text and sentiment analysis to truly understand what your customers love (or hate) about your brand!
Free Forever • No Feature Limitation • No Credit Card Required • Sign Up For Free ![]()
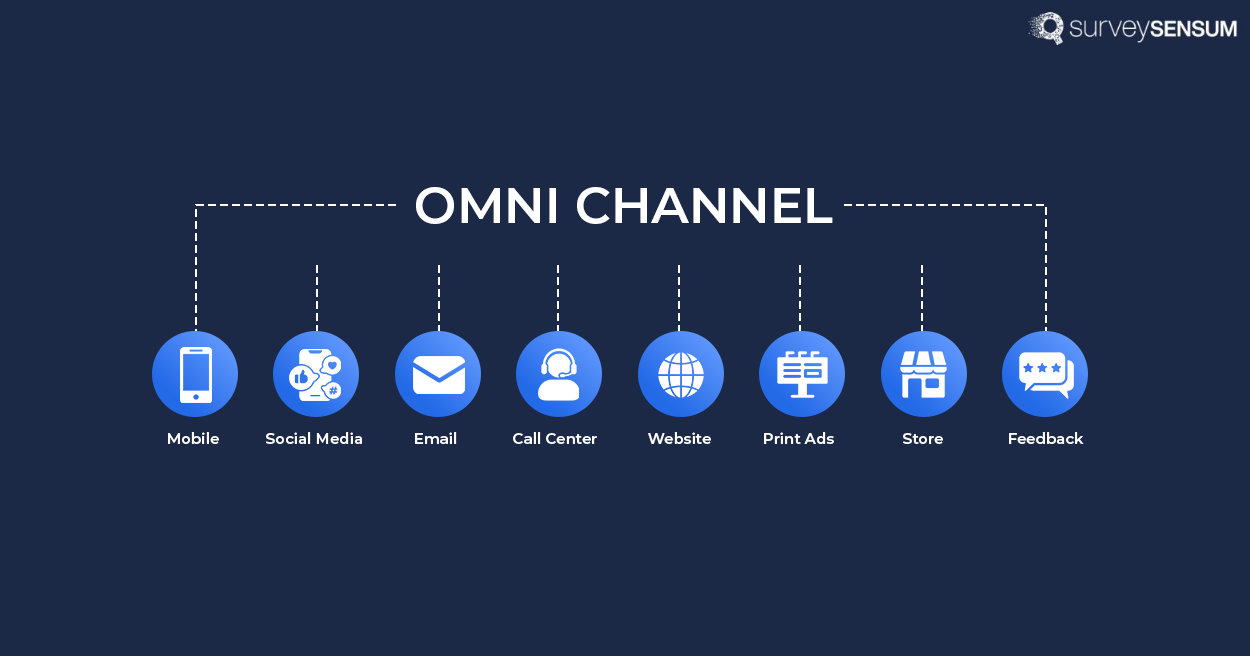
2. Measure Customer Experience At Every Touchpoint
Customers interact with your brand in countless ways – they visit your website, use your product, contact support, you name it. Not to forget that every customer’s path is different.
To really understand what’s happening throughout each unique customer journey, you must collect feedback at every step. This way, you can see exactly where customers experience disappointment.
In-app surveys, post-interaction emails, and website pop-ups are great ways to capture real-time customer feedback. It’s best to first map out the customer journey and identify key moments when you must collect feedback.
For example, post-checkout surveys reveal whether your customers find the checkout process frustrating while support follow-ups help you understand how efficiently support teams resolve issues, etc.
SurveySensum’s journey-based dashboards provide a structured view of your customer feedback across different touchpoints so that you can quickly track sentiment and key drivers at each stage. This helps you identify friction points and optimize experiences for a seamless customer journey.
3. Use Ad-Hoc Surveys To Uncover Deeper Insights
Running a targeted ad-hoc survey can reveal more specific insights at a specific time so that you can dig deeper into particular issues.
This is important because while broad surveys are good for understanding the overall customer sentiment, they might not answer the “why” behind challenges like a sudden drop in retention or changing preferences.
An ad-hoc survey, on the other hand, would focus only on churned customers to find out exactly why they left – whether it was due to a spike in prices, a feature getting retired, or poor customer service.
To run an ad-hoc survey effectively, you must:
- First define the problem you want to investigate. Is it the low retention rate or the surge in cart abandonment? A targeted ad-hoc survey must zero in on a single concern to uncover accurate insights.
- Find the right people to survey. If you’re worried about decreasing app engagement, survey long-time users to understand their pain points. Similarly, if you sense a change in purchase behavior, target repeat customers to see why they’re choosing different products.
- Keep the survey short and focused. An ad-hoc survey should contain questions that will get you the insights you need. Asking questions that are irrelevant to your goal will leave you confused.
Let’s say a subscription-based fitness app notices a sudden drop in its monthly renewals. Instead of going with a broad customer satisfaction survey that would only reveal the decline in engagement and not answer why it’s happening, the company launched an ad-hoc survey that targets only those customers who’ve stopped renewing their plans.
The survey contains specific questions like:
- What made you cancel your subscription?
- Did you find a better alternative? If yes, what made you switch?
- Would you consider returning in the future? If not, why?
This way, the company gains clear, actionable insights into what really made the users cancel their subscriptions and what’s the biggest driving force behind the slipping CSAT.
Why juggle multiple tools? With SurveySensum, you can also run ad-hoc surveys and gain deeper insights into customer churn, product satisfaction, and more – without ever switching between platforms!
Free Forever • No Feature Limitation • No Credit Card Required • Sign Up For Free ![]()
4. Leverage Role-Based Dashboards For Effective Data Sharing
Effective key driver analysis relies on providing the right people with the most relevant data. Role-based dashboards automatically filter and present insights on the most influential drivers for each department so that no one has to sift through piles of unnecessary information.
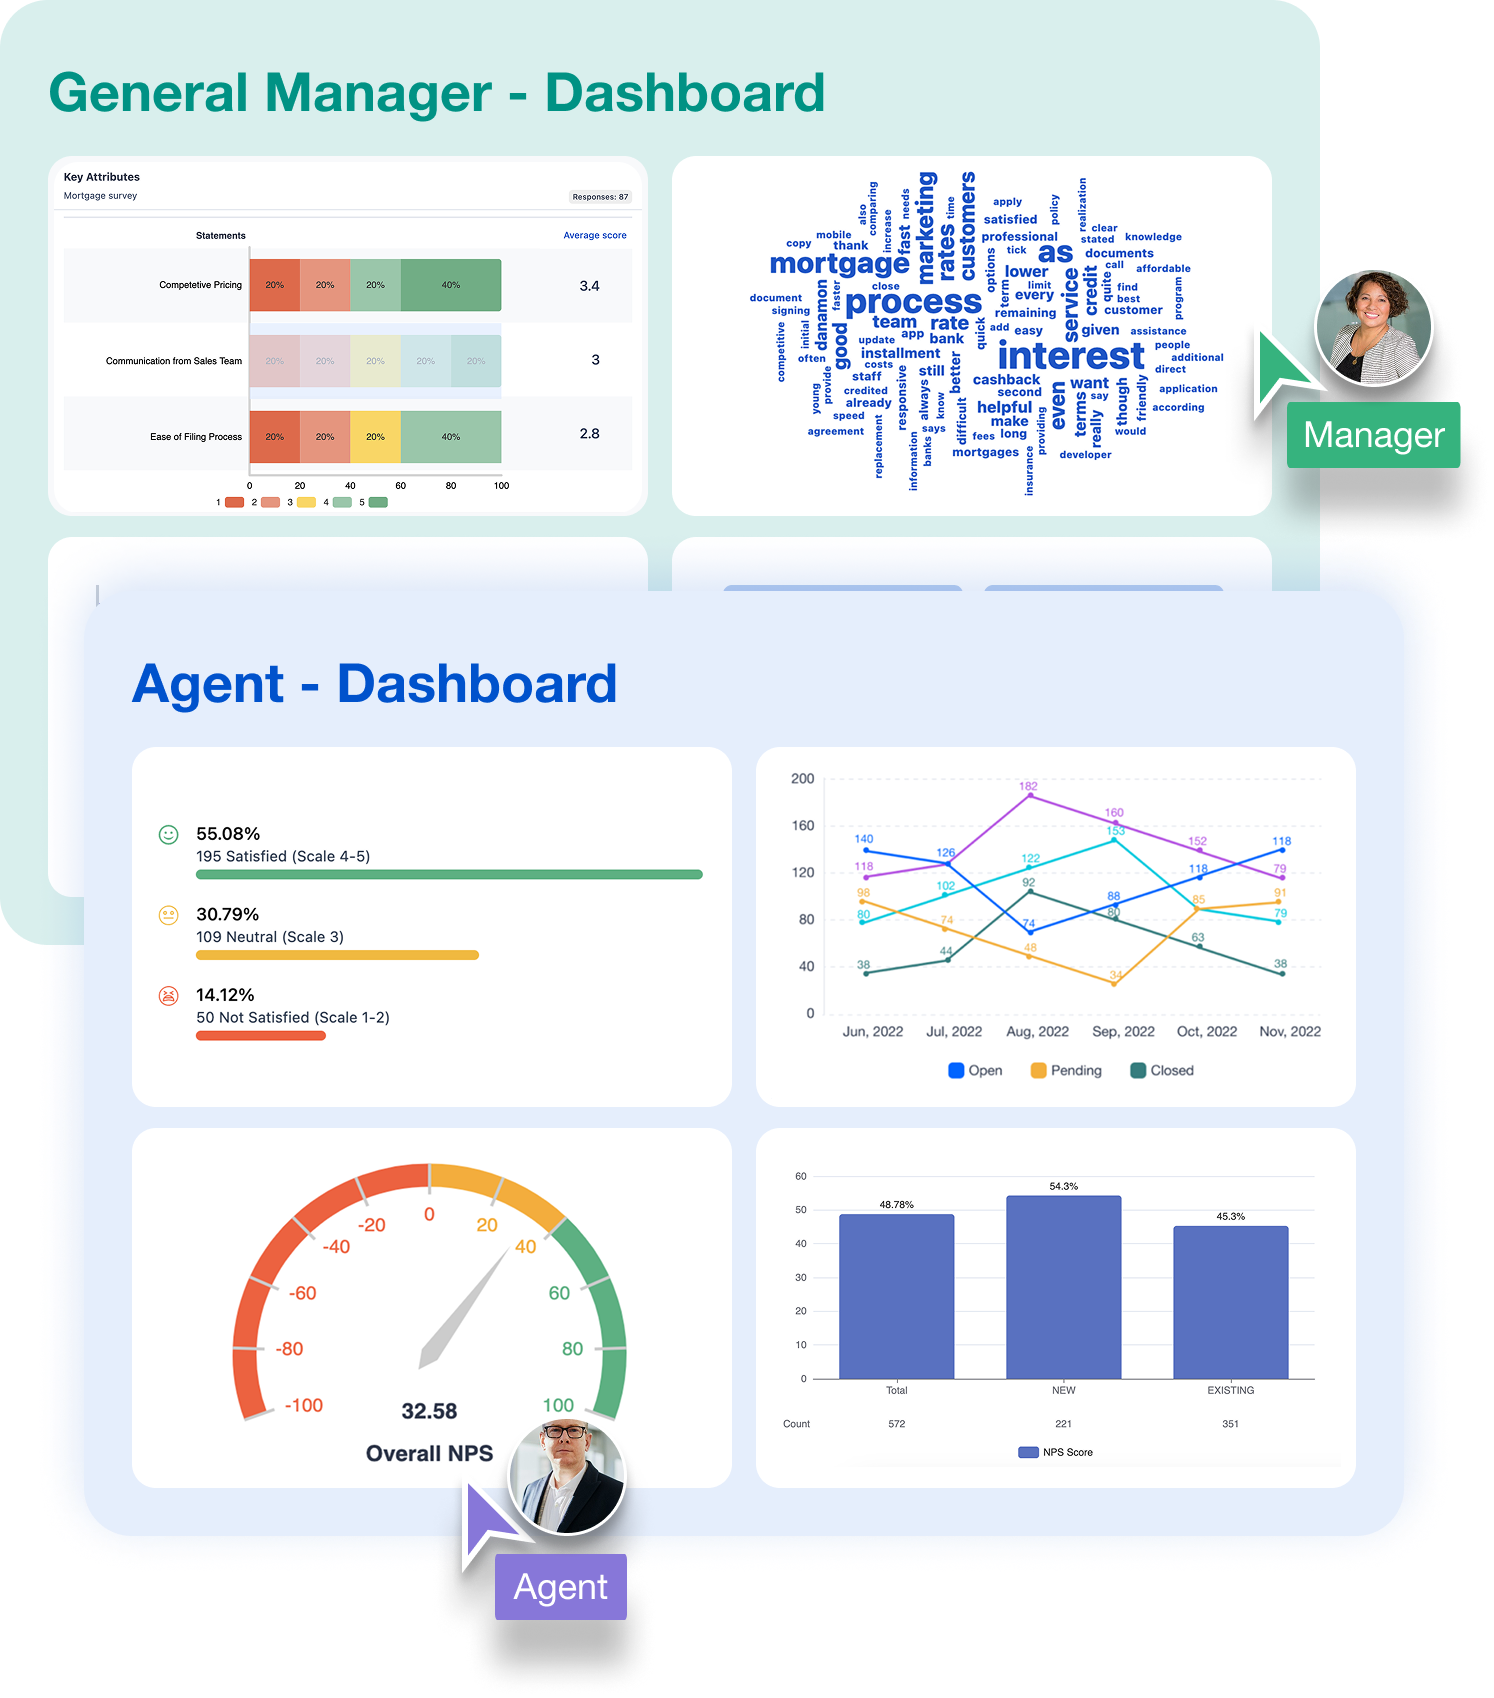
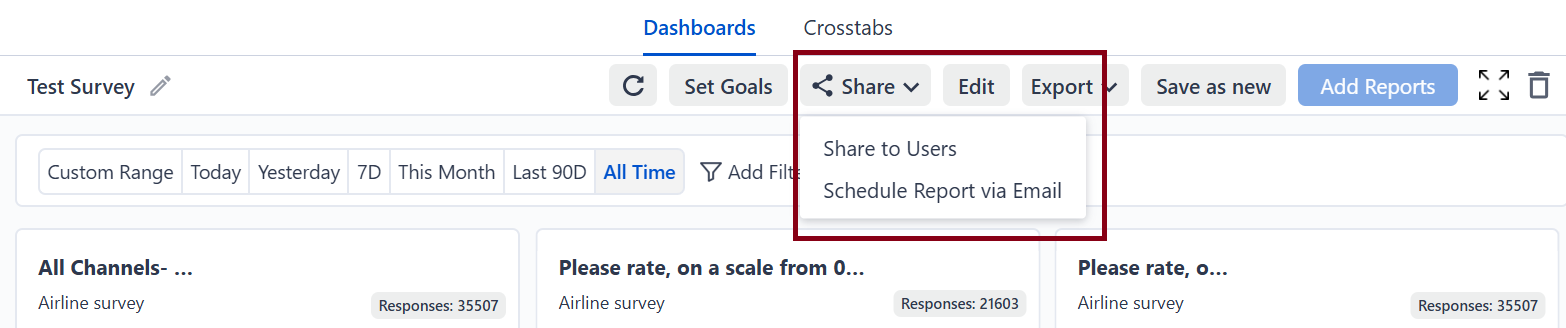
With SurveySensum’s role-based dashboards, you can share the data relevant for each team or stakeholders so they don’t have to dig through everything (that is not their use!). A product manager can track how product usability issues affect NPS, while a customer service manager gets to focus on customer support satisfaction metrics. This prevents information overload, improves decision-making, and enhances collaborations between teams. Moreover, you can schedule customer reports so that it directly lands into the leadership’s inbox (daily, weekly, monthly, and so on).
Now that you know how to perform key driver analysis, let’s learn exactly how you can leverage automation to do all the heavy lifting!
How Automation Works In Key Driver Analysis
The traditional approach to key driver analysis is exhausting. You’re stuck sorting through piles of survey data, manually spotting trends, and trying to make sense of complex data.
Automation transforms this process. Let’s understand how:
Step 1: Data Collection & Integration
The accuracy of your key driver analysis directly depends on how efficiently you gather and unify customer feedback across various touchpoints. AI-enabled key driver analysis software helps you:
- Centralize Data From Multiple Surveys: Platforms like SurveySensum let you automatically collect customer feedback data from numerous sources into a single, unified dashboard, thus eliminating the need for manual data entries.
- Collect Both Structured And Unstructured Data: Customer data exists in different formats – you’ve got survey ratings (quantitative), open-ended customer responses (qualitative) and even audio or chatbot transcripts. With AI-powered text analytics, you can easily categorize and tag different data types.
- Automate Data Mapping For Consistency: It’s important to map customer responses correctly to the corresponding variables to get meaningful insights.
For example, suppose you use a 1-5 rating scale for one survey and a 1-10 rating scale for another. Now without standardization, a “4” in the first dataset will not mean the same as a “4” in the second. With SurveySensum, you can automatically convert data into a common format for accurate comparisons.
Tired of wrestling with scattered customer feedback data? SurveySensum can help you centralize feedback from multiple sources, standardize customer ratings, and categorize insights – automatically and within just a few minutes!
Free Forever • No Feature Limitation • No Credit Card Required • Sign Up For Free ![]()
Step 2: AI-driven Insights With Text Analytics Software
The real challenge during a key driver analysis lies in extracting meaningful insights from the data you’ve collected and structured so far.
AI-powered text analytics tackle just that by:
- Scanning qualitative responses based on keywords, context, and urgency to detect common pain points (e.g., frequent mentions of “slow support” or “difficult checkout”). This helps you in understanding responses to open-ended survey questions without reading through thousands of answers.
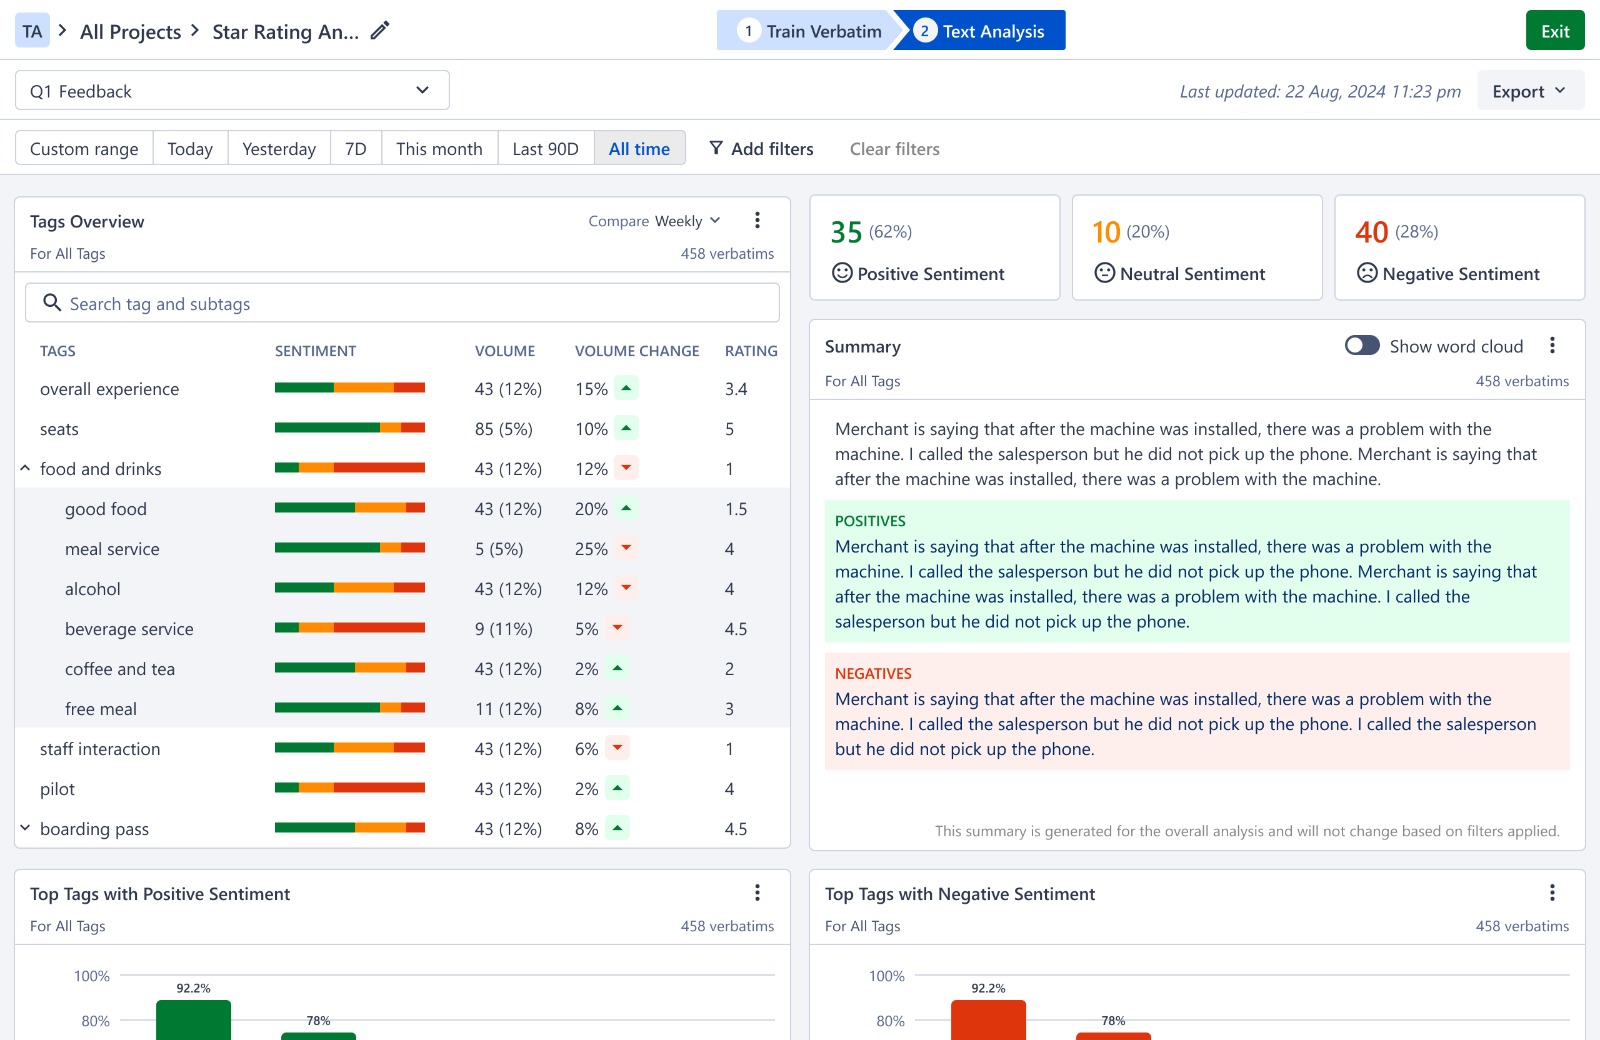
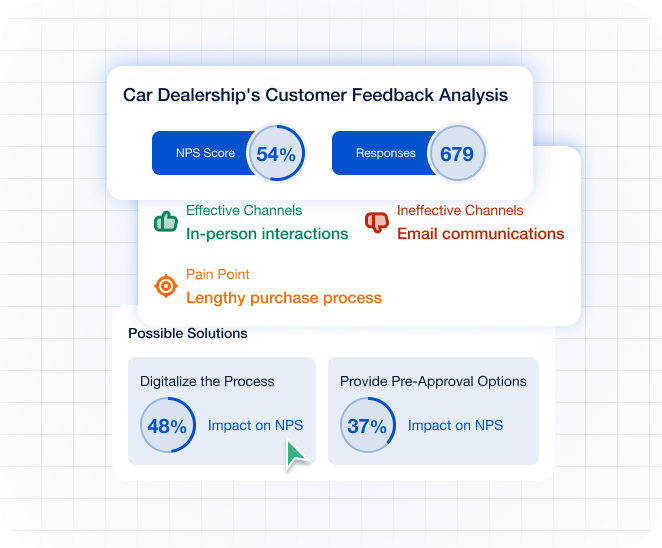
Automatically ranking key drivers based on their real impact. This is possible as AI models can quickly calculate which factors have the highest correlation with customer satisfaction levels.
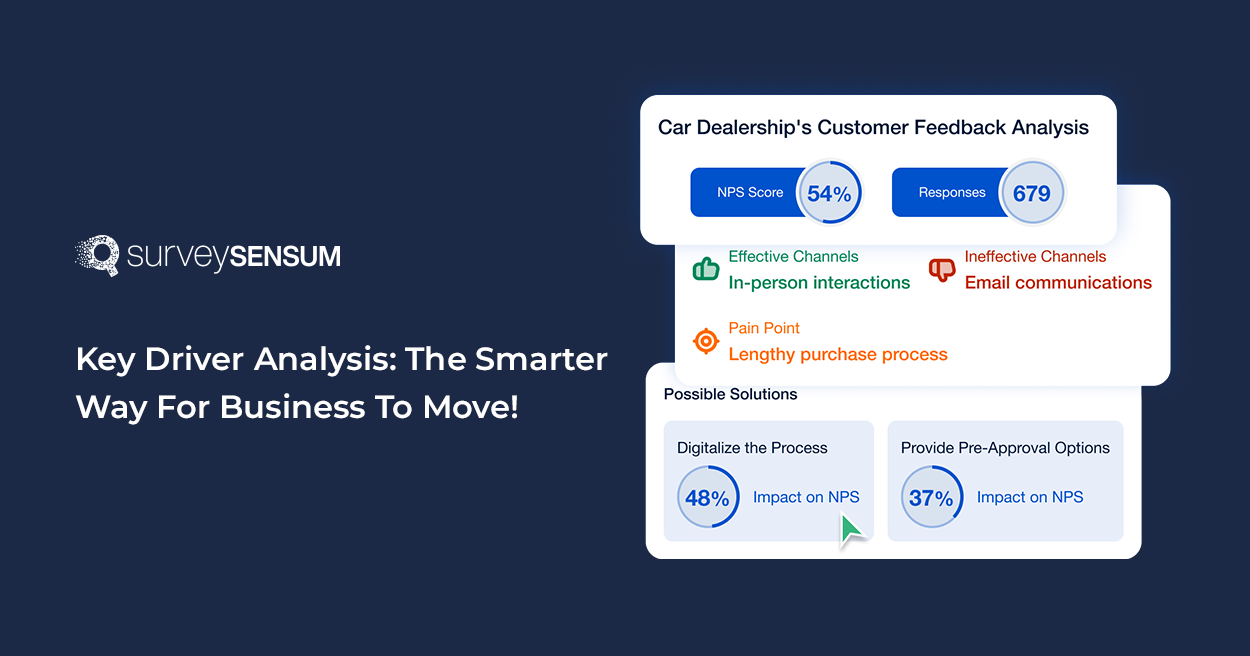
For example, in the image below, you can see to what extent different drivers impact NPS – digitalization (47%) and providing pre-approval options during the car dealership process (37%).
Step 3: Visualization Using Dashboards
Now that you’ve identified the key drivers, it’s time to make the insights accessible, actionable, and easy to interpret for everyone on the team. Here’s how AI makes this possible:
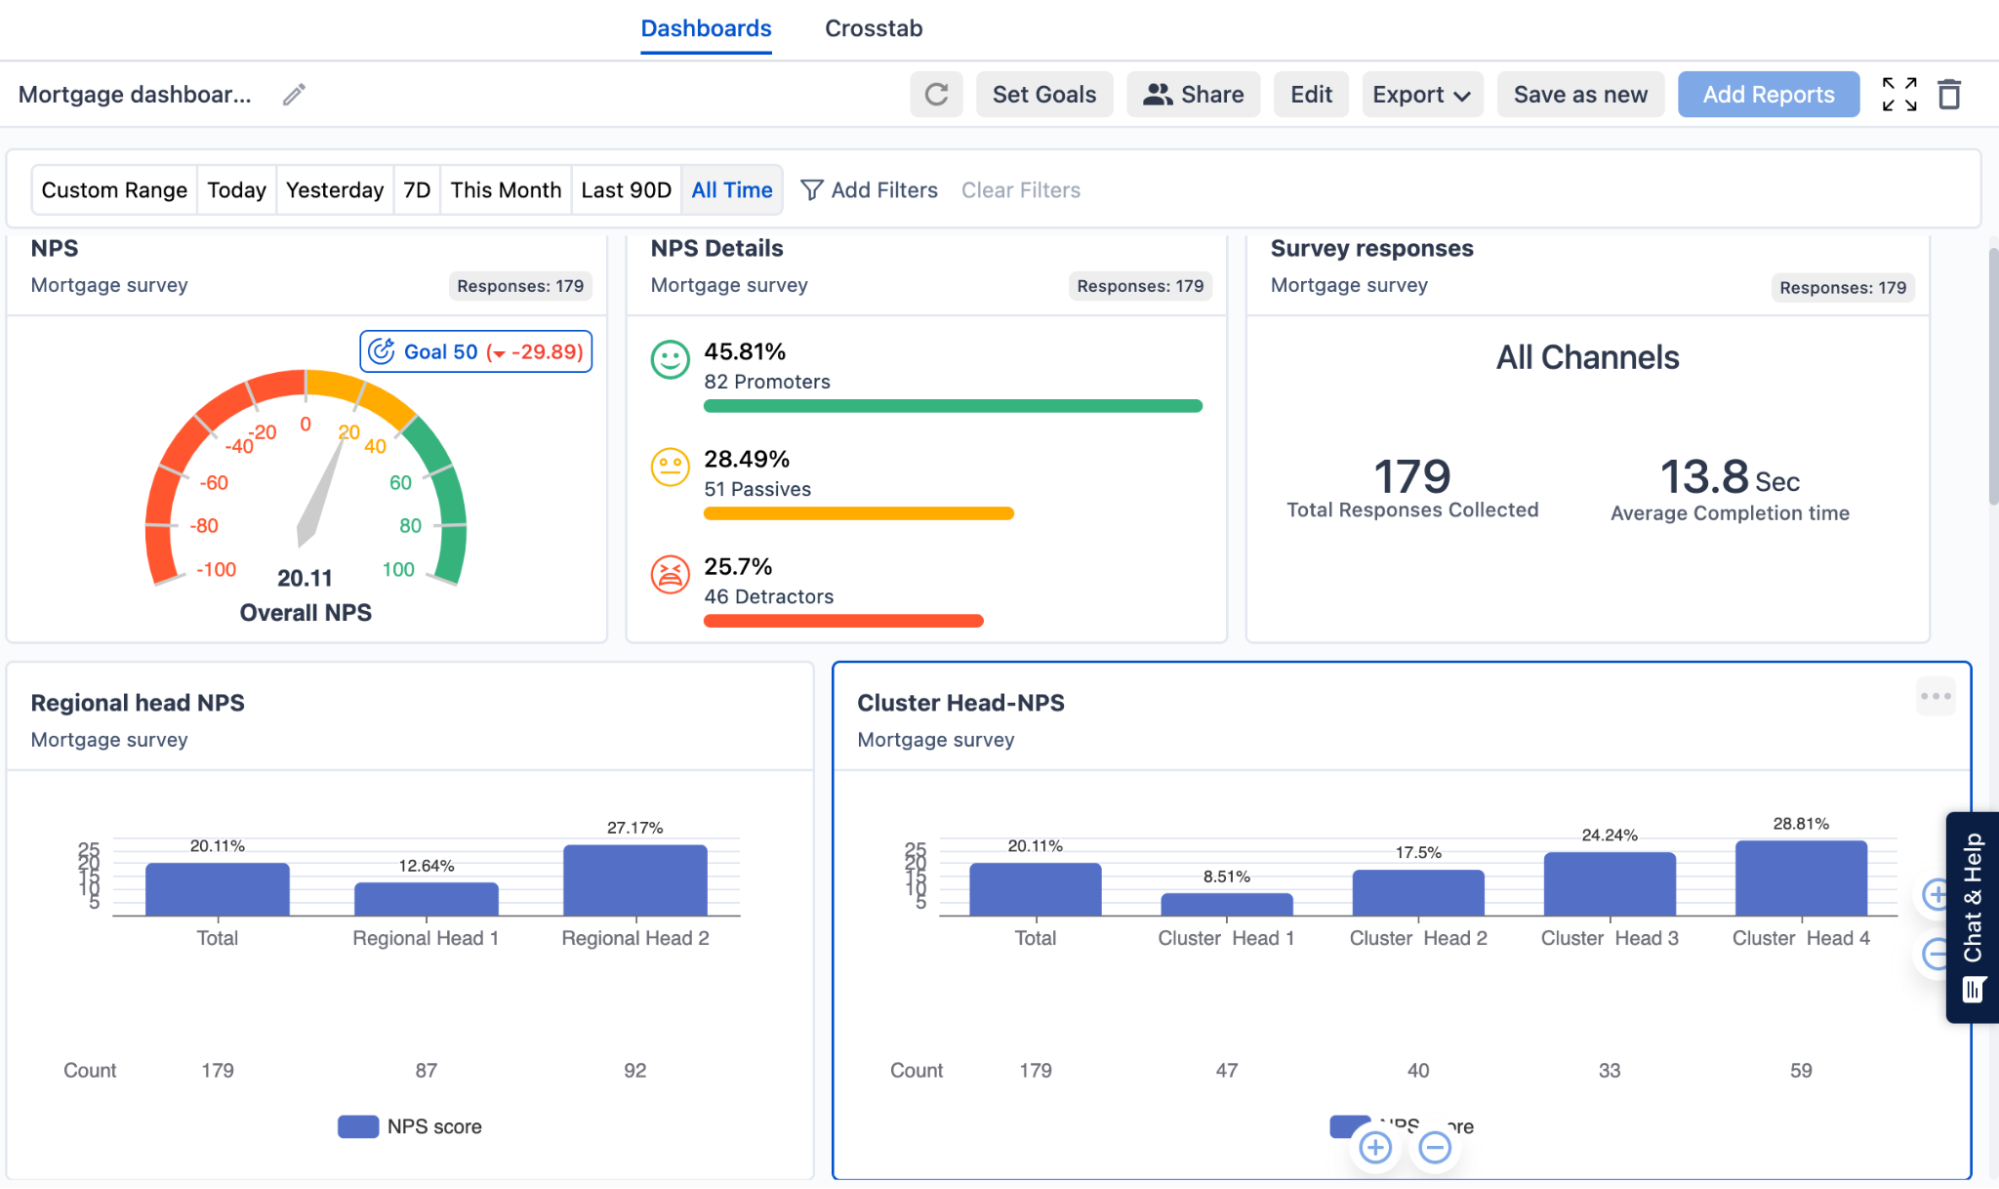
- Real-time dashboards provide interactive data exploration. SurveySensum’s dashboard instantly segments customer feedback based on different filters like demographics, product category, time period, etc, so that you can drill down into specifics without exhausting yourself over manual work.
- Automated reports ensure you’re always up-to-date with data. Instead of manually compiling insights, SurveySensum generates automated reports based on the latest customer feedback, summarizing key drivers and recent trends. These reports are delivered to your inbox at set intervals (daily, weekly, or monthly) – whatever suits you.
Conclusion
As we’ve seen above, key driver analysis in surveys comes with its own set of challenges. Businesses struggle to identify which drivers matter most; extracting actionable insights from overwhelming amounts of feedback is just another hurdle on top of that.
SurveySensum changes the game through AI-powered automation. The platform automatically determines key drivers, ranks them based on impact, and presents the insights in a clear, actionable manner.
With SurveySensum, you can know exactly what’s hurting customer satisfaction and receive proactive alerts when something starts affecting your key metrics like NPS or CSAT.
Automate key driver analysis with SurveySensum and focus on factors that impact your bottom line most. Centralize customer feedback, categorize and analyze it correctly, and find out what truly matters for your customers!
Free Forever • No Feature Limitation • No Credit Card Required • Sign Up For Free ![]()
Frequently Asked Questions on Key Driver Analysis
1. What is Key Driver analysis in survey data?
Key Driver Analysis is an analysis technique used to identify the factors (or “drivers”) that have the greatest impact on an outcome, such as customer satisfaction, NPS, or employee engagement. It helps businesses understand which aspects of their product, service, or experience most strongly influence customer behavior and where to focus improvement efforts.
2. How do I run a key driver analysis?
To run a successful key driver analysis, you need to:
- Prioritize factors with the help of text and sentiment analysis. With this tool, you can gain insight into which factors drive your outcome variable.
- Then you need to measure customer satisfaction at every touchpoint.
- You can also leverage ad hoc surveys to uncover deeper insights.
3. What is an example of a key driver?
An example of a key driver in customer experience (CX) might be:
- For an e-commerce business, delivery speed and customer support may be key drivers of customer satisfaction.
- For a software company, ease of use and customer service response time may be key drivers of NPS.
- For an airline, on-time performance and baggage handling might be key drivers of customer loyalty.
4. What is the purpose of driver analysis?
The main purpose of Key Driver Analysis is to identify and prioritize the factors that impact customer satisfaction, loyalty, and business success. It helps companies:
- Make data-driven decisions rather than relying on assumptions.
- Optimize resources by focusing on the factors that matter most to customers.
- Improve CX and retention by addressing pain points that significantly impact customer loyalty.
- Increase business growth by enhancing key touchpoints in the customer journey.
Automate Key Driver Analysis With SurveySensum and Focus on the Actions that Impact your Bottom Line!
Free Forever • No Feature Limitation • No Credit Card Required • Sign Up For Free ![]()

Increase ROI by 3x with targeted feedback & analysis
Boost Customer Satisfaction by up to 20%
Reduce Churn by identifying pain points in real time
See it in Action
Contents
How much did you enjoy this article?