Let’s say you built and implemented a strategy to upgrade the customer experience of your brand. But, how do you know if
- Your customers truly enjoying the new experience?
- Your company met the customer’s expectations?
- Your customers find it difficult to adjust to the new changes?
A number of questions follow suit, and you need answers for all of them to know if your customers are satisfied and if your business has taken the right route.
In short, the main idea is to analyze and understand the customer’s experience at every touchpoint with your brand and identify ways to improve that experience. And how do you do that? With the help of customer experience metrics.
So, let’s see what customer experience metrics are and the 5 most important metrics that your customer experience team should measure.
What are Customer Experience Metrics?
Customer experience metrics are key indicators that help you understand if your customer experience is good or bad. By analyzing these metrics, you can understand different aspects of your overall customer experience, identify areas that need improvement, and unlock the reasons behind experiences. Thus, you can improve your customer experience, increase customer retention and loyalty, and grow your business.
Now that you know what customer experience metrics are, let us see what are the most important metrics for a customer experience team to track.
5 Important Customer Experience Metrics Your Team Should Track
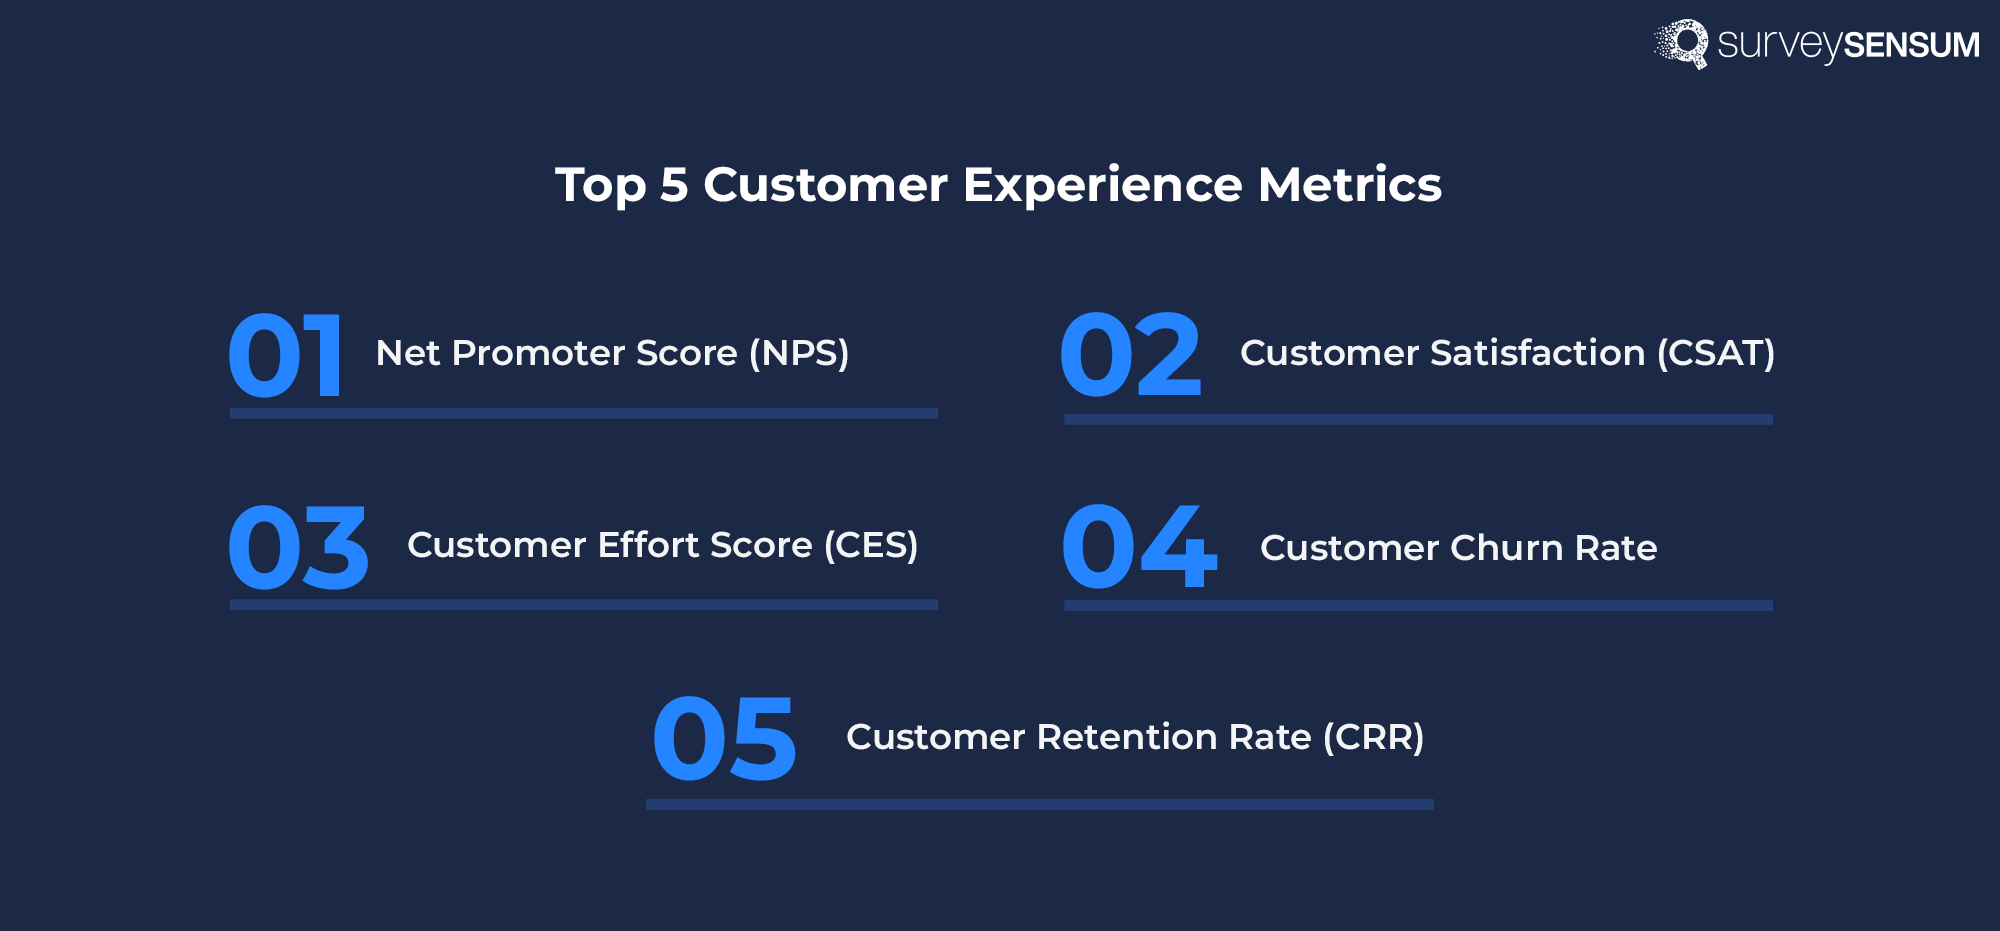
Let us explore the top metrics for customer experience that can act as powerful indicators of how well your customer experience efforts are performing.
1. Net Promoter Score (NPS)
Net Promoter Score or NPS is a customer experience metric that helps you gauge customer loyalty by understanding their likelihood to recommend your business to an acquaintance.
It is arguably the most popular customer experience metric used by companies. In fact, Net Promoter Score is used by two-thirds of the Fortune 1000 companies to help them understand customer loyalty.
Net Promoter Score helps you in gauging customer experience through a simple survey question “On a scale of 0-10, how likely are you to recommend our product/service to a friend or colleague?”
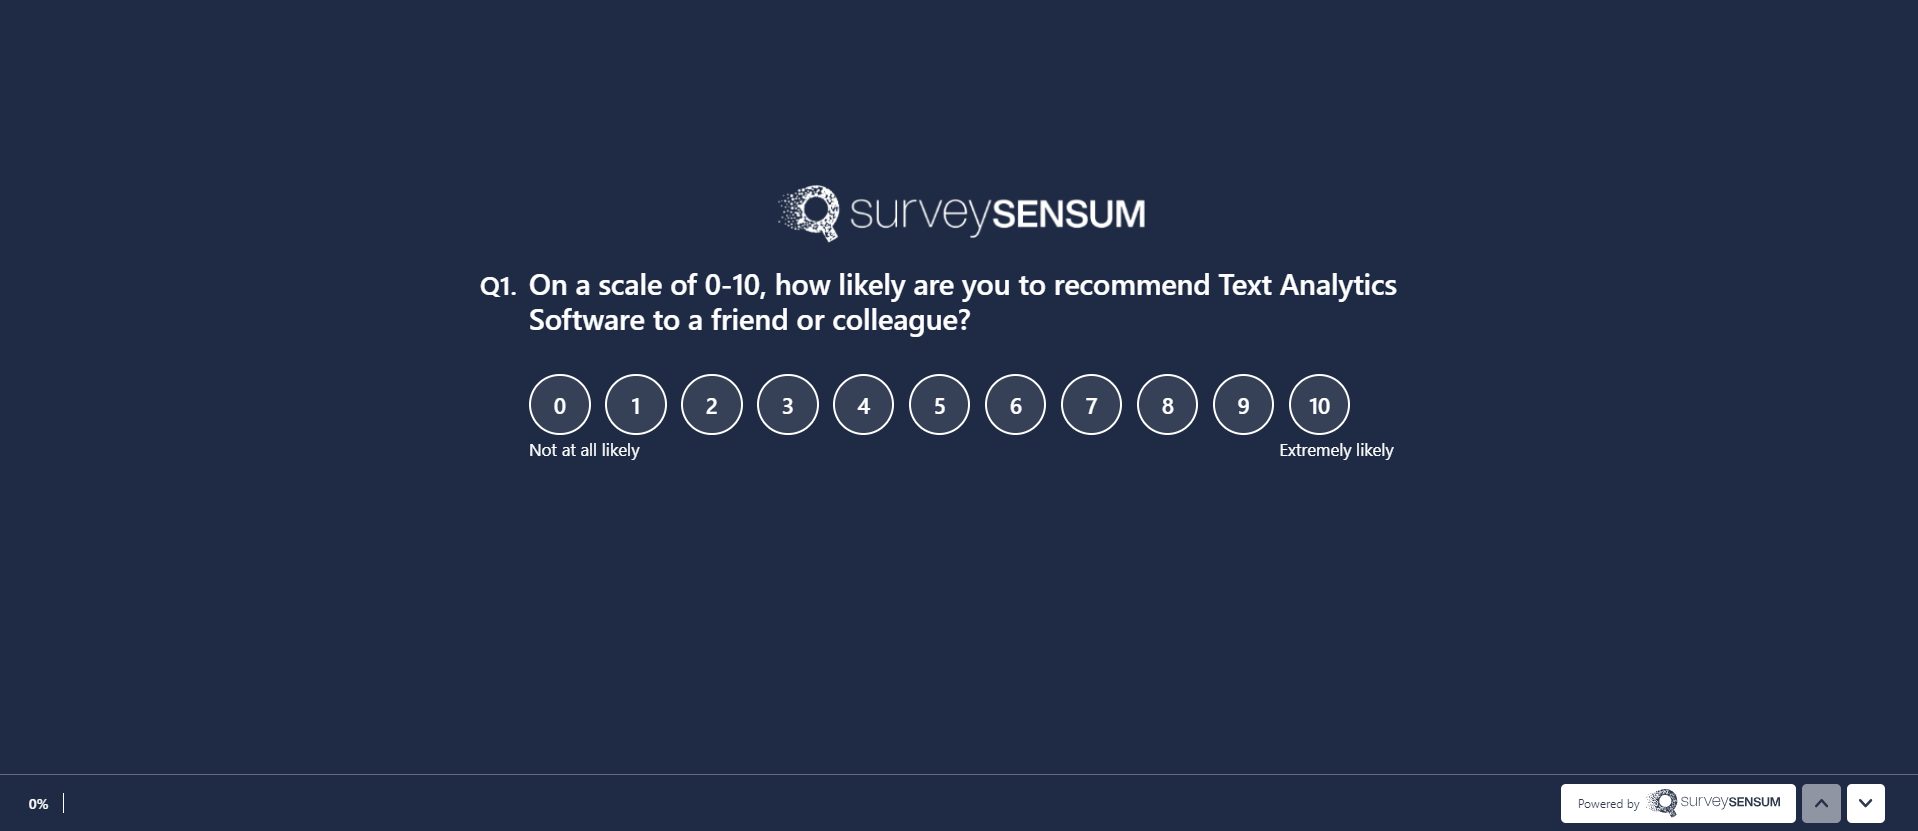
Now, customers can select an NPS score as per their experience and give open-ended feedback explaining the reason behind their score.
You can collect the NPS scores and calculate your overall NPS score. You can then compare this NPS score with the average NPS of your industry to find where your company stands with regard to customer satisfaction and loyalty.
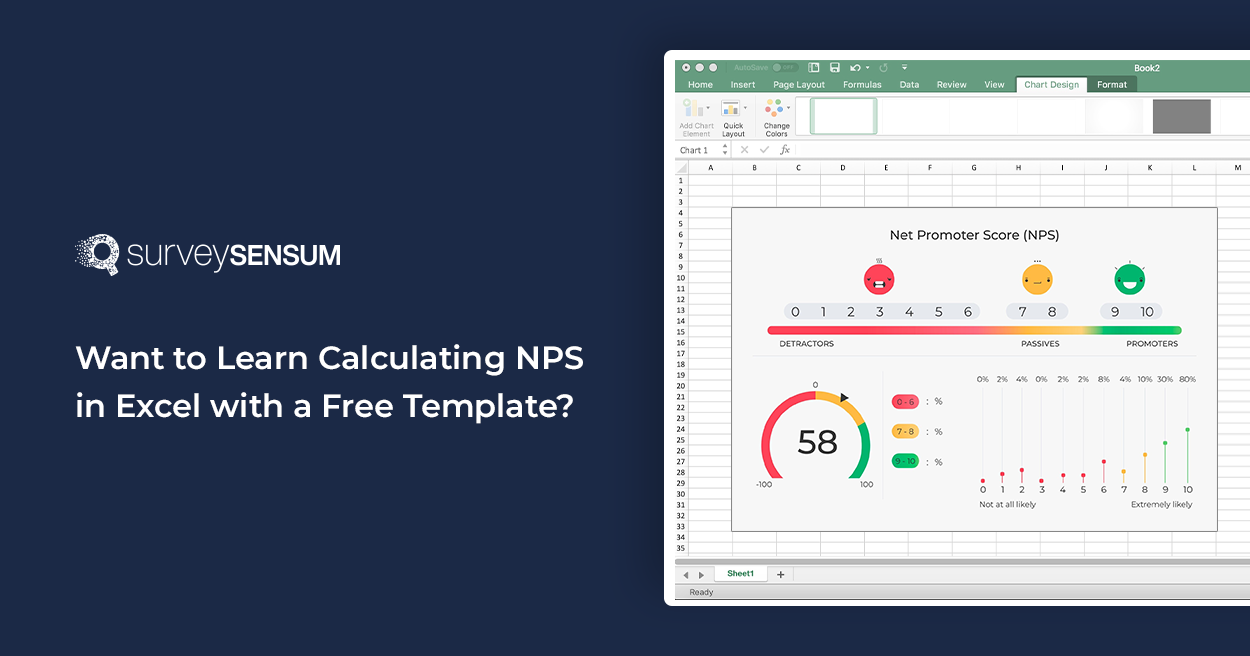
Now, how do you calculate your NPS score? Firstly, you should find the number of promoters ( happy customers who scored you 9 or 10), detractors (unhappy customers whose scores range from 0-6), and passives (neutral customers who scored you 7 or 8).
You can then calculate NPS using the formula = %Promoters – % Detractors
While a positive score indicates that your company has more loyal customers, a negative score suggests that you have more dissatisfied customers.
→ Note: The significance of your NPS score also depends on the industry average. For example, an NPS score of 40 might be excellent in the construction industry but considered average in the technology industry.
That being said, you should keep in mind that you are surveying thousands of customers. Manually, taking the count of promoters and detractors, etc., analyzing their scores and opinions can be a strenuous task. Therefore, it’s advisable to use a robust NPS software to survey, calculate, and analyze NPS scores quickly and accurately.
Build Robust NPS Surveys with SurveySensum and Procure Valuable Insights to Make Actionable Decisions
Free Forever • No Feature Limitation • No Credit Card Required • Get a Live Demo ![]()
2. Customer Satisfaction (CSAT)
Customer Satisfaction or CSAT is a measure of how satisfied your customers are with your products/ services and with your overall business. Customer satisfaction can be measured at various touch points like post-purchase, onboarding of clients, etc. via well-crafted CSAT surveys.
You can create a CSAT survey with questions like “How satisfied are you with your recent purchase?”
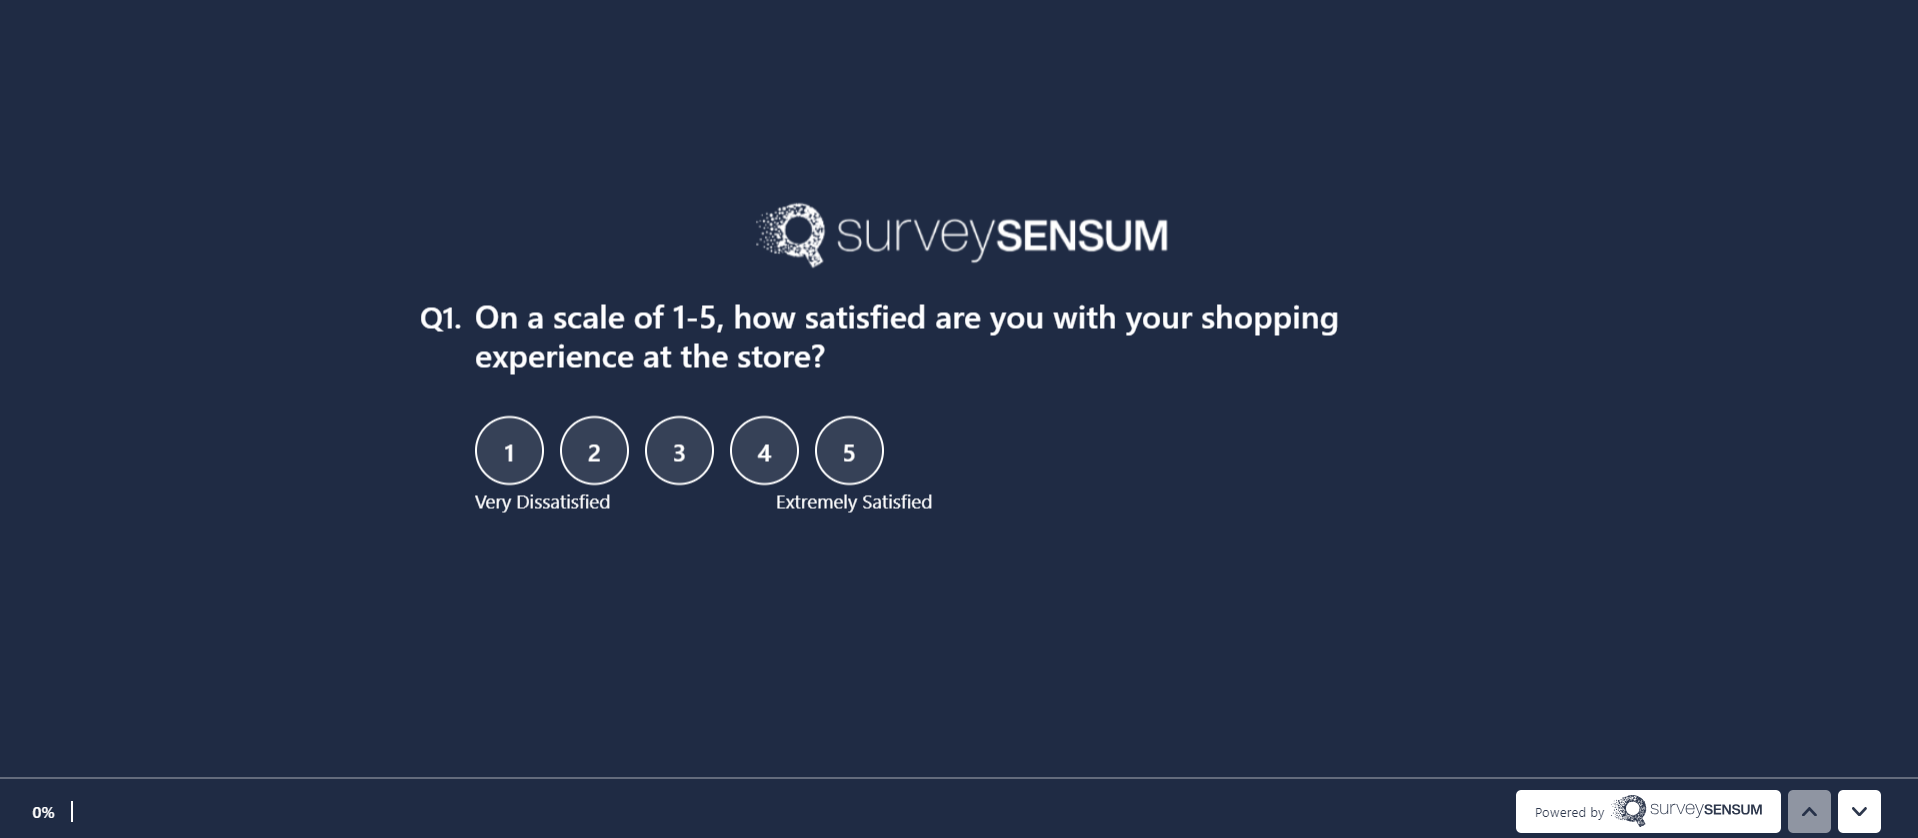
You can base this question on a Likert scale or any other point scale so that it is easier for your customers to answer. This question can be customized according to the customers’ touchpoints.
Following this question, you can add an open-ended question to understand the reason behind their score.
Once you get the result of the survey, calculate the CSAT score and analyze the feedback using survey software to get valuable insights.
Measure Customer Satisfaction Efficiently with Well-Built CSAT Surveys
Free Forever • No Feature Limitation • No Credit Card Required • Get a Live Demo ![]()
3. Customer Effort Score (CES)
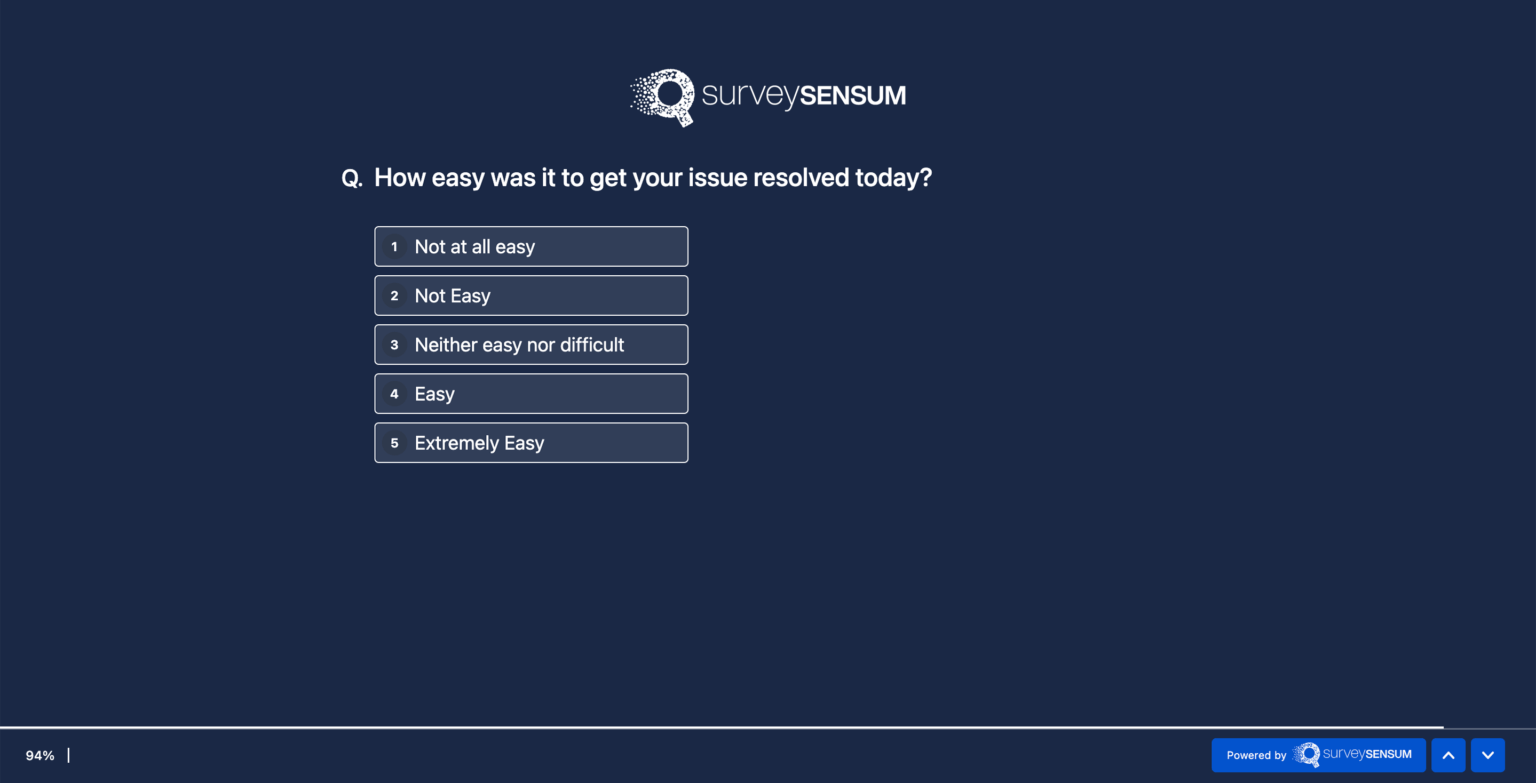
Customer Effort Score or CES gauges the effort your customers have to put into completing a task or resolving an issue with your business. CES surveys ask customers to rate their experience based on how easy or difficult they find it to use a company’s products or services.
For example, in your CES survey, you can ask the question “On a scale of 1 to 5, how easy was it to access our support team to resolve your issue?”
The average score can then be calculated to determine the overall CES.
Now, how does CES qualify as a customer experience metric? Because it helps you evaluate your customer satisfaction by measuring the ease with which your customers experience your product or service. Customers rely on your product or service to simplify their work, but if the experience makes it difficult for them to access your product/service, then it could lead to unsatisfied customers. In short, higher CES means lower satisfaction. So, your goal should be to lower the CES by providing a seamless experience.
Gauge CES Effectively and Deliver a Seamless Customer Experience
Free Forever • No Feature Limitation • No Credit Card Required • Get a Live Demo ![]()
4. Customer Churn Rate
Customer churn rate measures the percentage of customers who end their collaboration with a company over a specific time period. This metric indicates customer attrition and dissatisfaction.
Now how do you calculate and find your customer churn rate?
Customer Churn Rate = (The number of lost customers during a specific period / Number of customers at the start )* 100
Let’s say you had 10000 customers at the beginning of the month and 500 customers canceled their subscriptions during the month. Then the churn rate would be:
(500/10000) * 100 = 5%
Calculating the customer churn rate can help you find the causes of dissatisfaction and address the issue to bring significant growth to your company. Even a 5% reduction in customer churn can increase your profits by 25% – 95%!
5. Customer Retention Rate (CRR)
As the term suggests, customer retention rate is the percentage of customers that your company retains over a specific time period.
The customer retention rate can be calculated using the following formula:
Let’s consider
- CS : Customers at the start of a specific time period
- CE: Customer at the end of a specific time period
- CN: Newly acquired customers during that period
CRR = (CE – CN)/ CS) * 100
Now, let’s say you had 1000 customers at the start of a year. During the year you acquired 600 new customers and by the end of the year, you have a total of 1500 customers.
Then your CRR would be : ((1500 – 600) / 1000)*100 = 90%
Which Customer Experience Metric Should You Track?
There are a number of metrics for measuring customer experience out there. We showed you the examples of top 5 customer experience metrics that most companies use and drive results from.
Now, the question is what metrics should you choose for your customer experience?
The choice depends on your objective. Choose the CX metric that aligns with your goal. Suppose your focus is to boost customer loyalty. In that case, NPS is the right metric for you and if the aim is to identify the key drivers of customer satisfaction, then CSAT is the metric to go for. Now, if your objective is to understand the ease with which your customers can access your services, then CES would be a suitable choice.
That being said, conducting NPS, CSAT, and CES surveys manually can be challenging when you have hundreds or thousands of customers.
You need a survey builder like SurveySensum to help you build surveys, gather feedback, analyze these customer experience metrics, and procure valuable insights to make meaningful decisions and close the feedback loop.
Surveysensum offers a plethora of strong and relevant features to power up your surveys and analyze customer experience metrics. This comprehensive platform boasts of :
- NPS, CES, CSAT survey builder
- Customizable templates
- 30+ Question formats
- Survey branching
- Anonymous surveys
- Multilingual surveys
- AI-driven text analytics
- Powerful dashboard
Added to all this is the personalized guidance of their CX experts, who will assist you throughout the entire process of creating surveys and gauging the customer experience metrics via dedicated workshops.
Track Key Customer Experience Metrics with SurveySensum and Boost Customer Satisfaction
Free Forever • No Feature Limitation • No Credit Card Required • Get a Live Demo ![]()

Increase ROI by 3x with targeted feedback & analysis
Boost Customer Satisfaction by up to 20%
Reduce Churn by identifying pain points in real time
See it in Action
Contents
How much did you enjoy this article?