Are your customers truly happy and satisfied with your brand? Understanding and measuring customer satisfaction and loyalty is very crucial, yet many businesses struggle to do that.
That’s where NPS (Net Promoter Score) can be your closest ally. By categorizing customers into promoters, passives, and detractors, you will get a clear picture of your customer sentiments.
But once you have the survey responses, how do you calculate your NPS? Doing it manually can be really cumbersome!. So how do you fix it?
Well, one way to do is in Excel. It simplifies this overall process by allowing businesses to collect responses, calculate NPS in Excel, and analyze trends over time.
I’ll walk you through the ins and outs of ‘how to calculate NPS in Excel’ and how you can automate the entire process if you choose to use SurveySensum. But first, let’s discuss how the NPS calculation actually works.
How Does the NPS Calculation Actually Work?
Let’s understand how NPS calculation actually works. NPS is calculated based on customer responses to a simple question, which is:
‘On a scale of 0-10, how likely are you to recommend our product/service to a friend or colleague?’
Based on their rating and responses, customers are classified into three groups.
- Promoters (9-10): Highly satisfied customers who are likely to recommend your brand.
- Passives (7-8): Neutral customers who are satisfied but not enthusiastic.
- Detractors (0-6): Unhappy customers who may discourage others from using your service.
NPS is calculated by subtracting the percentage of detractors from the percentage of promoters.
NPS = %Promoters – % Detractors

“For example, you conducted a survey with 100 respondents, and their responses are distributed as follows:
- 50 Promoters (50%)
- 30 Passives (30%)
- 20 Detractors (20%)
NPS = 50% – 20% = 30
In this example, the NPS score is 30, showing positive customer sentiment but with room for improvement. A higher NPS means strong customer loyalty, while a lower score indicates the need for better engagement.”
Now that we have talked about the working of NPS and its formula, let’s shift focus to calculating NPS in Excel.
Step-by-Step Guide: How to Calculate NPS in Excel
If you don’t have the budget for NPS tools, you can rely on good old Excel to calculate your net promoter score. We’ll walk through the exact steps to calculate NPS in Excel, from organizing your data to automating the process for ongoing analysis.
Step 1: Organize Your Data in Excel
The first and very important step is to organize your data in an Excel sheet. You can set up three columns. Here’s how:
| Customer ID | Score (1-10) | Category |
| C001 | 9 | Promoter |
| C002 | 7 | Passive |
| C003 | 6 | Detractor |
- Customer ID: A unique identifier for each respondent (optional but useful for tracking).
- Score: The rating given by the customer (ranging from 0-10).
- Category: This will be automatically filled based on the customer’s score using an Excel formula.
Step 2: Categorize Respondents Using Excel Formulas
Next, we need to categorize each respondent as promoter, passive, or detractor based on their. Instead of sorting this manually, you can use an IF function in Excel to automate this.
=IF(B2>=9, “Promoter”, IF(B2>=7, “Passive”, “Detractor”))
You can apply this formula in the ‘Category’ column for all responses. It will help you categorize customers as:
- Promoters (9-10) → Advocates who love your brand.
- Passives (7-8) → Neutral customers who are satisfied but not enthusiastic.
- Detractors (0-6) → Unhappy customers who may discourage others from using your service.
Step 3: Count the Number of Promoters, Passives, and Detractors
Now that we have categorized customer responses, the next crucial step is to count how many fall into each category. You can use the COUNTIF function in Excel for that.
For Count of Promoters
=COUNTIF(C:C, “Promoter”)
For Count of Passives
=COUNTIF(C:C, “Detractor”)
For Count of Detractors
=COUNTIF(C:C, “Detractor”)
These formulas will count the number of customers in each group, which you would need to calculate NPS.
Step 4: Calculate Percentage of Each Category
To get a precise NPS score, you need to calculate the numbers of promoters and detractors out of the total survey responses.
Total Responses
=COUNTA(B:B)
Percentage of Promoters
=(COUNTIF(C:C, “Promoter”) / COUNTA(B:B)) * 100
Percentage of Detractors
=(COUNTIF(C:C, “Detractor”) / COUNTA(B:B)) * 100
This will give you the proportion of customers in each category, which we’ll use in the final NPS formula.
Step 5: Apply the NPS Formula in Excel
Now, subtract the percentage of the detractors from the percentage of the promoters to get the net promoter score.
=(COUNTIF(C:C, “Promoter”)/COUNTA(B:B) * 100) – (COUNTIF(C:C, “Detractor”)/COUNTA(B:B) * 100)
For instance, if:
- 50% of respondents are Promoters
- 20% are Detractors
- 30% are Passives (ignored in the calculation
Then, the NPS would be:
NPS = 50% – 20% = 30
This implies that your Net Promoter Score is 30. It indicates a positive sentiment but with room for improvement.
Step 6: Automate NPS Calculation with Pivot Tables
Now, it’s time to use Excel magic to get things on autopilot. You can automate NPS tracking using pivot tables instead of entering formulas manually. Here are the steps to do that:
- Select your dataset (including Customer ID, Score, and Category columns).
- Click on Insert → PivotTable and choose New Worksheet.
- Drag Category into the Rows section.
- Drag Customer ID (or Score) into the Values section and set it to Count.
- Convert counts into percentages by clicking Value Field Settings → Show Values As → % of Grand Total.
- Use a Pivot Chart to visualize trends over time.
And just like that, you are done! Now you can update your NPS data dynamically and monitor trends without manually calculating scores every time.
Let’s talk about how you can calculate NPS using a best-in-class tool like SurveySensum.
Benefits of Using SurveySensum for NPS Calculation
While tools like Excel can be used for NPS calculation, it can be daunting to do the manual entry and formula setup in them.
And that’s where SurveySensum’s NPS software comes to your rescue. The software streamlines the entire process by automating data collection, analysis, and reporting. This makes NPS management more efficient and insightful.
Now let’s talk about the crucial perks and benefits of using SurveySensum for your NPS calculation needs.
No Manual Work
Automation is the best perk that SurveySensum offers to its users. It completely eliminates the need for manual calculation. Once survey responses are collected, the platform automatically categorizes respondents into Promoters, Passives, and Detractors, and computes the NPS in real-time. This automation reduces the risk of human error and saves valuable time.
- AI -Powered Insights
If your NPS calculation tool is not giving you AI-powered insights, it is not the one for you. SurveySensum uses artificial intelligence to analyze the open-ended feedback. It helps to identify recurring themes, sentiments, and key drivers behind customer scores. This way, it provides a deeper understanding of customer sentiments and trends.
- Real-Time Reporting
As the saying goes, you can’t improve what you can’t measure. Therefore, having real-time reporting becomes important for you. SurveySensum offers interactive dashboards that update in real-time. It allows you to monitor NPS fluctuations over time. This immediacy enables prompt responses to emerging issues and the ability to capitalize on positive trends.
- One Click Report Generation
Generating reports in SurveySensum is as easy as one, two, three. It simplifies the reporting process by enabling users to export NPS reports in various formats, including PDF, Excel, or PPT, with just one click. This functionality facilitates easy sharing of insights across teams and stakeholders.
- Seamless Integration
Most of the NPS calculating tools offer all the required benefits but often lag behind when it comes to integration capabilities. However, SurveySensum integrates seamlessly with Customer Relationship Management (CRM) systems, customer support platforms, and other analytics tools. These integrations ensure that NPS data is synchronized across platforms. It offers a unified view of customer feedback and facilitates more informed decision-making.
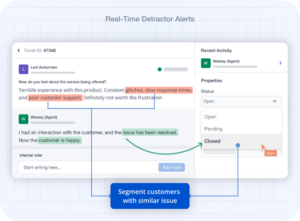
- Close the Feedback Loop With Real-time Ticketing System
Analyzing feedback is just not enough, you need to take action on it. You can use the ticketing system to address customer concerns and enhance the customer experience in real time. It helps you to automatically create tickets by converting negative feedback into tickets for immediate resolution. Then, you can route tickets to the relevant departments like product, support, and operations. In addition to that, you can visualize the progress on the dashboard and drop timely follow-ups.
Calculate and analyze your NPS score with SurveySensum to unlock powerful insights and drive customer loyalty!
Free Forever • No Feature Limitation • No Credit Card Required • Sign Up For Free ![]()
Now that we have talked about the key benefits of SurveySensum, let’s talk about the actual steps to do that.
5 Easy Steps to Calculate NPS Using SurveySensum
A best-in-class tool like SurveySensum comes with plenty of advanced features like cross-tab analysis, an analytical dashboard, and automated data capabilities to get you a 360-degree view of your progress. Here are the five easy steps to calculate NPS utilizing SurveySensum.
1. Pick an NPS Template and Customize it
The first step to calculating NPS is to design an impactful survey. And with SurveySensum’s survey builder, all you have to do is pick an NPS template! Personalize it in your brand theme, tweak the questions, and you are good to go!
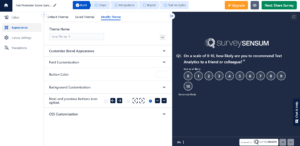
2. Distribute the Survey Via The Channel of Your Choice
Once your survey is ready, the next thing you need to do is to distribute it. The biggest challenge you might encounter in this process is reaching out to the right folks at the right time. That’s where SurveySensum can come to your rescue. It offers multi-channel survey distribution channels like email, QR codes, and WhatsApp.

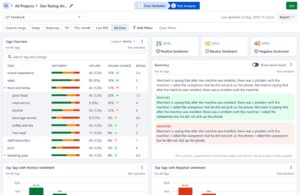
3. Analyze Responses With AI-Powered Analytics
After distributing the survey, the responses will start to roll in. Using SurveySensum’s AI-powered text analytics tool, you can automatically tag and subtag feedback into relevant categories based on relevant keywords and themes. In addition to automation, you can train the AI models to enhance accuracy and customize categorization to fit specific business needs. The AI analyzes up to 10,000 open-ended feedback responses in just 5 seconds with 99% accuracy.
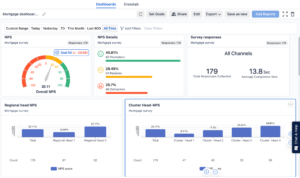
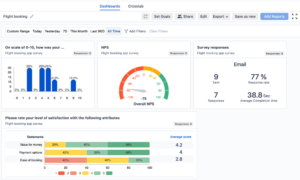
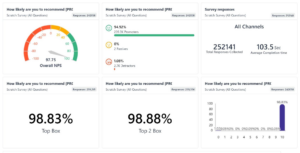
4. View Real-Time NPS Score on an Interactive Dashboard
When it comes to calculating your NPS score, SurveySensum does all the math and presents it in a visually engaging dashboard. You can see your latest NPS score in real-time, track changes in the customer sentiments, and analyze NPS by location, customer segments, or product category. You can easily identify what’s working for you and what’s not using these rich insights.
5. Generate Reports With Actionable Insights
When all the customer feedback analysis is gathered, it’s time to get a complete insight from the reports. For this, go to the SurveySensum Dashboard and click on the ‘Add Report’ button on the top right. Now you can generate an NPS report as you like! Also, you can structure the report in different formats like numerical and word cloud. And SurveySensum always gives you options to customize the reports according to your business’s branding, color, and logos. Then you can share the report with relevant stakeholders across teams with a shareable link.

Ready to boost customer satisfaction by accurately measuring and automating your NPS calculation with SurveySensum? Get a demo!
Free Forever • No Feature Limitation • No Credit Card Required • Sign Up For Free ![]()
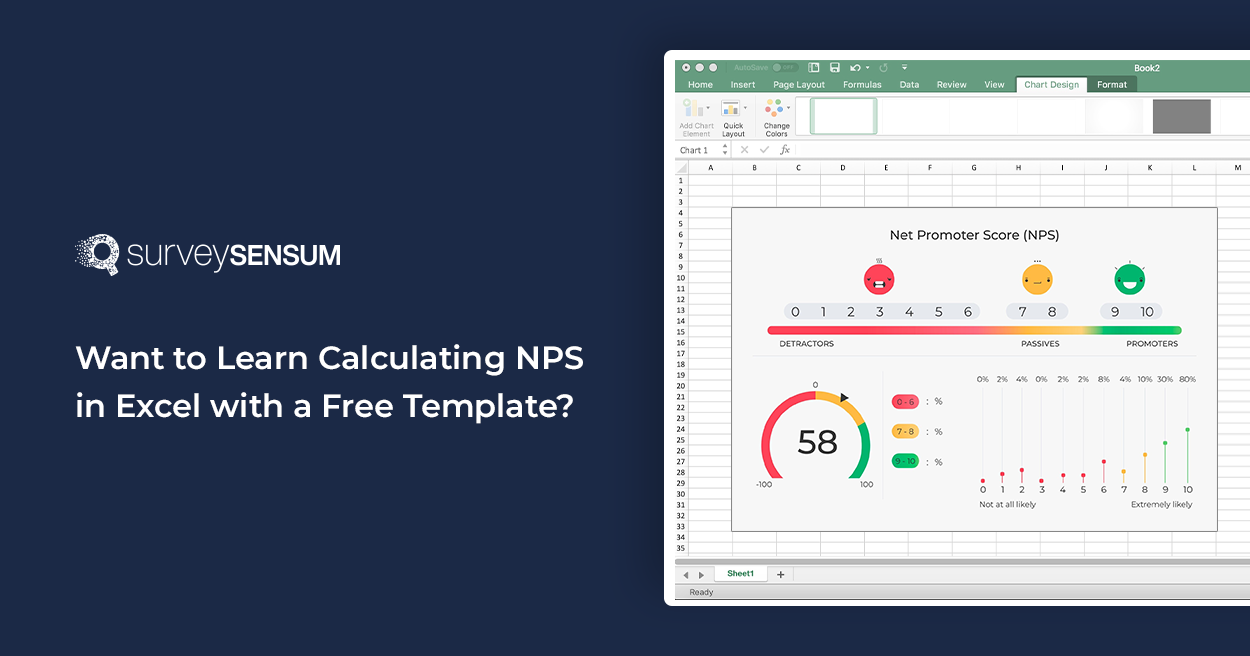
Also, to make your NPS calculation efforts a breeze, we have prepared a free NPS Excel template. It is a simple tool to help you calculate NPS manually with ease. It takes the guesswork out of the process and ensures accuracy. Whether you want to double-check your numbers or quickly analyze responses, this template gives you a structured way to get your NPS score without any hassle.
Free NPS Excel Template for Manual Calculation
If you prefer calculating NPS manually or want to double-check your results, we’ve got you covered!
Using this template, you can input your survey responses, and the formula will instantly calculate your NPS score—no manual math required.
Now that you have access to the free NPS Excel template, let’s shift focus to the common mistakes to avoid while calculating NPS.
Common Mistakes to Avoid When Calculating NPS
Even though NPS is a simple metric, many businesses make small mistakes that lead to inaccurate scores and misleading insights. Here are some common pitfalls to watch out for:
-
Not Including All Survey Responses
One of the biggest mistakes that you can make is cherry-picking responses or excluding data you believe is not relevant. Your NPS score should reflect the full range of customer sentiment. Ignoring certain responses skews the data.
- Misclassifying Promoters, Passives, and Detractors
Misclassifications lead to incorrect NPS calculations and a flawed understanding of customer sentiment. Stick to the official classification and ensure that your survey system or Excel sheet correctly categorizes responses.
- Using the Wrong Formula to Calculate NPS
Even a small miscalculation can significantly alter your final NPS score. It can lead to incorrect assumptions about customer loyalty. Therefore, always use the correct formula.
And if you think calculating the NPS manually would be a hassle for you, use SurveySensum to launch, analyze, and improve your NPS score. Get a demo today!
Free Forever • No Feature Limitation • No Credit Card Required • Sign Up For Free ![]()
-
Forgetting to Convert Fractions Into Percentages
The next common mistake is leaving numbers as decimals rather than converting them into percentages. Leaving numbers as decimals drastically lowers your NPS score. It leads to confusion and misinterpretation of customer sentiment.
- Not Segmenting NPS Score for Deeper Insights
A single NPS score doesn’t tell the full story. You might miss critical insights that could help improve specific customer relationships. Break down your NPS by customer type, geography, product line, or customer journey stage to uncover patterns and opportunities for improvement.
- Ignoring NPS Follow-Up Feedback
Without analyzing why customers gave their scores, you’re left guessing about what needs improvement. You can use AI-powered text analysis, available in SurveySensum, to categorize feedback by sentiment and topic.
Conclusion
Manually calculating NPS using Excel is possible. However, it is not always practical, especially when dealing with large data sets. That’s where SurveySensum offers a faster, more accurate, and hassle-free solution. It automates survey distribution and data collection, eliminates errors with AI-driven analytics, and offers real-time insights, not just raw scores.
By tracking NPS regularly and using a smart platform like SurveySensum, businesses can gain deeper insights into customer loyalty, take proactive action, and drive long-term growth.
So, are you ready to move beyond spreadsheets and start making data-driven decisions effortlessly? Try SurveySensum today and transform your NPS strategy. Get a demo!
Free Forever • No Feature Limitation • No Credit Card Required • Sign Up For Free ![]()

Increase ROI by 3x with targeted feedback & analysis
Boost Customer Satisfaction by up to 20%
Reduce Churn by identifying pain points in real time
See it in Action
Contents
How much did you enjoy this article?