Ever wondered how likely your customers are to recommend your brand to others? That’s exactly what Net Promoter Score helps you uncover!
Simple, straightforward, and incredibly powerful, NPS isn’t just a number – it’s a window into your customers’ loyalty and satisfaction.
Let’s dive deeper into this concept with this in-depth guide to discover what is net promoter score, how it is calculated, and how to analyze and improve it.
What is the Net Promoter Score (NPS)?
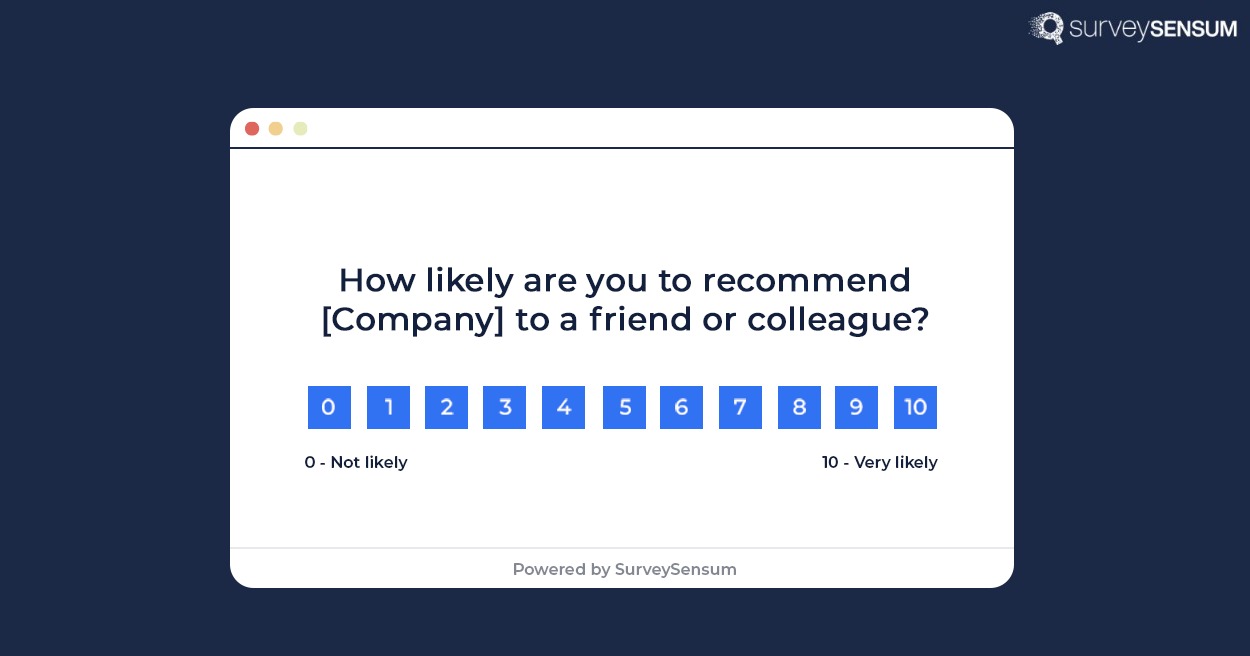
Net Promoter Score is a CX metric used to measure customer loyalty and satisfaction based on their likelihood to recommend a company’s products or services to others. It is calculated by asking customers a single question –
“On a scale of 0 to 10, how likely are you to recommend [company/product/service] to a friend or colleague?”
Based on their responses, customers are categorized into three groups:
- Promoters (score 9-10): Customers who are highly satisfied and likely to recommend the company.
- Passives (score 7-8): Customers who are satisfied but not enthusiastic enough to actively promote the company.
- Detractors (score 0-6): Customers who are unhappy and may spread negative word-of-mouth about the company.
Now that we know what NPS is, let’s understand how NPS helps measure and improve customer loyalty.
How Does NPS Measure Customer Loyalty?
NPS is a key metric for gauging customer loyalty – the reasons are twofold.
It ties into other critical loyalty metrics, such as customer retention rates and referral potential. Promoters are not only more likely to stay with your brand but are also more inclined to recommend it to others, fueling organic growth. On the other hand, a rising number of detractors can signal potential churn risks that need immediate attention.
Another way NPS measures loyalty is through the follow-up question: “What is the reason for your score?” This NPS follow-up question gives you actionable insights into what’s driving customer loyalty—or dissatisfaction. It’s a goldmine of qualitative data that helps you identify what customers love and where you can improve.
Basically, NPS isn’t just about a score; it’s about understanding the dynamics of your customer relationships. By keeping an eye on these insights and aligning them with metrics like CLV and retention rates, you can turn NPS into a powerful tool to enhance loyalty and drive growth.
Now that the role of NPS is clear for business success, let’s dive deeper into NPS and understand its types and use cases.
Different Types of NPS Surveys
Running NPS is easy if you do it right.
There are several key aspects to it.
To make the best use of an NPS survey, you must identify the right type of survey to run, the scenario for which the survey will be used, and the question that will provide maximum responses.
That’s why, you ought to know the various types of surveys that are available at your disposal. The two main types of NPS surveys are:
1. Relationship Surveys
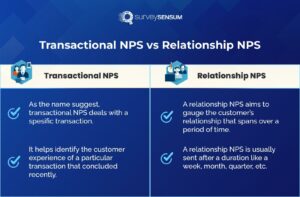
Surveys conducted to gauge customer loyalty (or their positive relationship) with the brand are referred to as relational surveys.
They ask customers about the overall experience of dealing with the brand, their satisfaction levels, and suggestions for improvement. They are conducted in the frequency of quarterly, half-yearly, or yearly.
Example: An on-demand video streaming service sends a monthly survey requesting feedback about its service quality — “Based on your overall experience with our streaming service, how likely are you to recommend us to a friend or family?”
2. Transactional Surveys
Transactional surveys (tNPS) aim to investigate the customer feedback for each transaction. The primary purpose of this type of survey is to figure out how to improve customer experience.
They are usually sent immediately or within a day or two from the completion of the transaction. Transactional surveys are apt for companies with a limited number of interactions with the customer and hence limited opportunities to seek feedback.
Example: A five-star hotel seeking feedback from a guest who completed a stay recently — “On a scale of 0-10, how likely are you to recommend us to a friend or family based on your recent stay with us?”
But now that you know the different types of NPS surveys, let’s understand when to send NPS surveys.
When to Send NPS Surveys?
1. Sending Relationship NPS Surveys At Regular Intervals
For relationship NPS, it’s best to send surveys at key touchpoints in the customer journey, such as after a significant milestone (e.g., after a certain period of using the product or service, after a major interaction like a support call or purchase).
Let’s understand the different touchpoints for different industries to understand why and when to launch the NPS survey questions.
| Industry | Survey Frequency | Best Time to Send | Why to Send |
| B2B SaaS | Quarterly or bi-annually | Before subscription expiration or contract renewals | To gauge satisfaction with the software, identify areas for improvement, and understand how changes impact customer loyalty |
| B2B Manufacturing | Semi-annually or annually | Before subscription expiration or contract renewals | To assess satisfaction with product quality, delivery timeliness, and overall customer service, and to maintain long-term relationships with clients |
| B2B Marketing & Advertising | After campaigns, projects, or at the end of contracts | After major marketing campaigns to understand the impact of your efforts on client satisfaction | To evaluate the effectiveness of marketing efforts, campaign performance, and client satisfaction with the provided services |
| B2B Fintech | Quarterly or semi-annually | Annually to gauge long-term satisfaction | To understand satisfaction with financial services, assess user experience, and gather feedback on new features or improvements |
| B2B Service | Quarterly or semi-annually | Shortly after service delivery | To assess customer satisfaction with service quality, responsiveness, and professionalism, and identify areas for service improvement |
| B2B Logistics | Quarterly or after major logistics operations | After important shipments or orders | To evaluate service reliability, timeliness, accuracy of deliveries, and communication effectiveness |
| Insurance | Annually | Near policy renewal dates or after significant interactions | To assess customer satisfaction with policy coverage, claims handling, premium rates, and customer service quality |
| Automotive | After every service appointment | After vehicle servicing appointments or dealership visits | To help you understand customer satisfaction levels with the service quality, customer support, and overall dealership experience |
| Telecom | Annually | After service disruptions, or during new service or feature rollouts | To evaluate service reliability, network coverage, call quality, internet speed, and customer support effectiveness |
2. Sending NPS Surveys After Critical Customer Milestones
For transactional NPS, you should send surveys immediately following the transaction or interaction. This ensures that feedback is fresh in the customer’s mind and provides insights into their satisfaction with that particular experience.
For example, after a customer completes a purchase, receives a service, or interacts with customer support, sending a transactional NPS survey allows you to gather feedback specific to that interaction.
Turn every customer interaction into an opportunity for improvement with SurveySensum’s journey-based NPS surveys to track feedback at key touchpoints!
Now that you have sent your NPS survey and gathered responses, let’s see how to calculate the NPS score.
How to Calculate NPS?
The general formula for NPS score calculation is as follows.
NPS = % of Promoters – % of Detractors
So, for example, if the responses for 100 survey feedback are as follows
- Promoters – 25
- Passives – 55
- Detractors – 20
Then your percentages would be 25%, 55%, and 20%, respectively.
Therefore the NPS score would be (25% – 20%), which is +5.
A positive NPS is a good indication. However, a Net Promoter Score of 5 shows that there is plenty of room for improvement. We will discuss this further in the next section.
But is calculating your NPS enough? Your NPS score is not the endgame, what you do with the score is what matters the most. So, gather actionable insights from your NPS feedback and prioritize your action to transform your feedback into revenue with SurveySensum’s top NPS experts!
Is the NPS score you just calculated actually good? Well, let’s understand that.
What is a Good NPS Score?
As a thumb rule, if the NPS score is less than 0, it is a cause for worry as it is a negative NPS score. And an NPS score above 0 is considered okay as it is a positive NPS score, but it still has some further categorization, let’s take a closer look.
- NPS of 50 or Higher: This is often considered a good NPS score and suggests that a company has a strong base of loyal customers who are highly likely to recommend its offerings to others.
- NPS score ranges from 30 to 49: This range is still regarded as good, indicating that the company has a solid foundation of satisfied customers.
- NPS between 0 and 29: While positive, this range suggests room for improvement. It signifies that the company has more satisfied customers than dissatisfied ones.
Now, the best approach is to identify the NPS scores of your competitors so you know where you stand – which takes us to NPS benchmarking.
NPS Benchmarking for Industries
NPS benchmarking is the process of comparing the NPS score of a company with its industry standards or competitors. The purpose of benchmarking is to understand your business’s performance with respect to others in the industry.
For instance, in the context of NPS in banking, a financial institution can evaluate its NPS score and compare it with other banks in the same sector. If the score falls below the industry benchmarks, it becomes imperative to investigate the reasons behind customer dissatisfaction and implement corrective measures.
Here’s a study on NPS benchmarks by industry that reveals the average NPS score by different industries. The study was conducted for different industries, analyzing NPS in B2B and B2C. Based on the study, here are the NPS scores by industry.
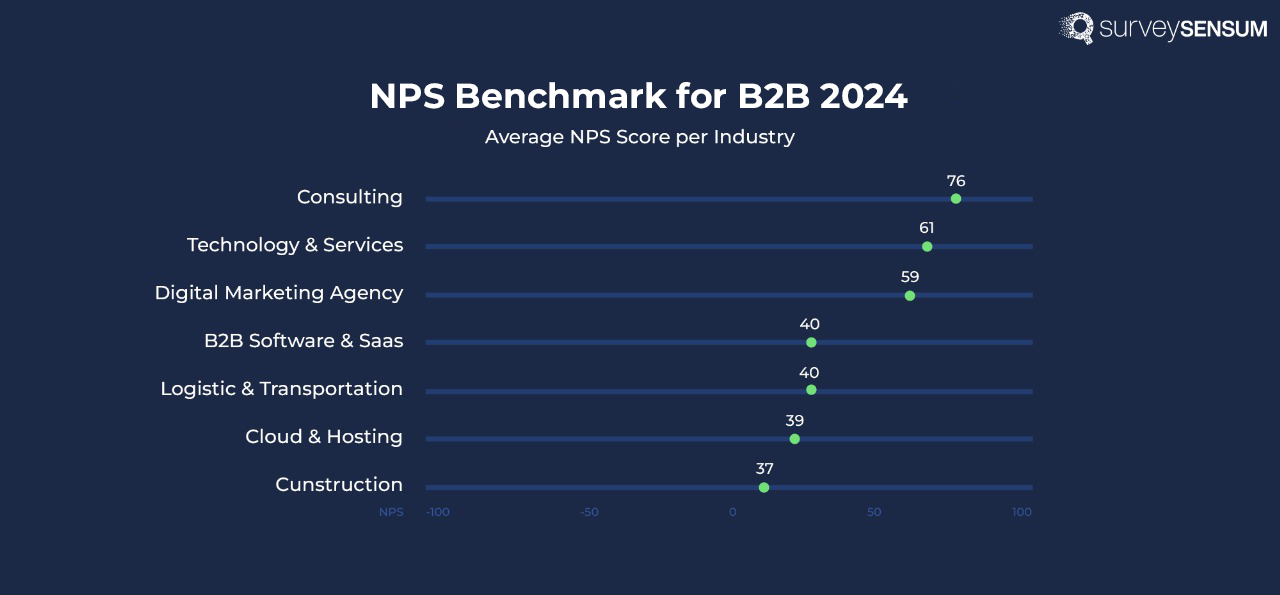

*Source: Retently 2024 NPS Benchmarks for B2B & B2C
Now that we understand how to determine if your NPS score is good or bad, let’s focus a bit more on the importance of NPS.
Why You Shouldn’t Ignore the Net Promoter Score?
Here are 8 strong reasons why you should use the NPS Score.
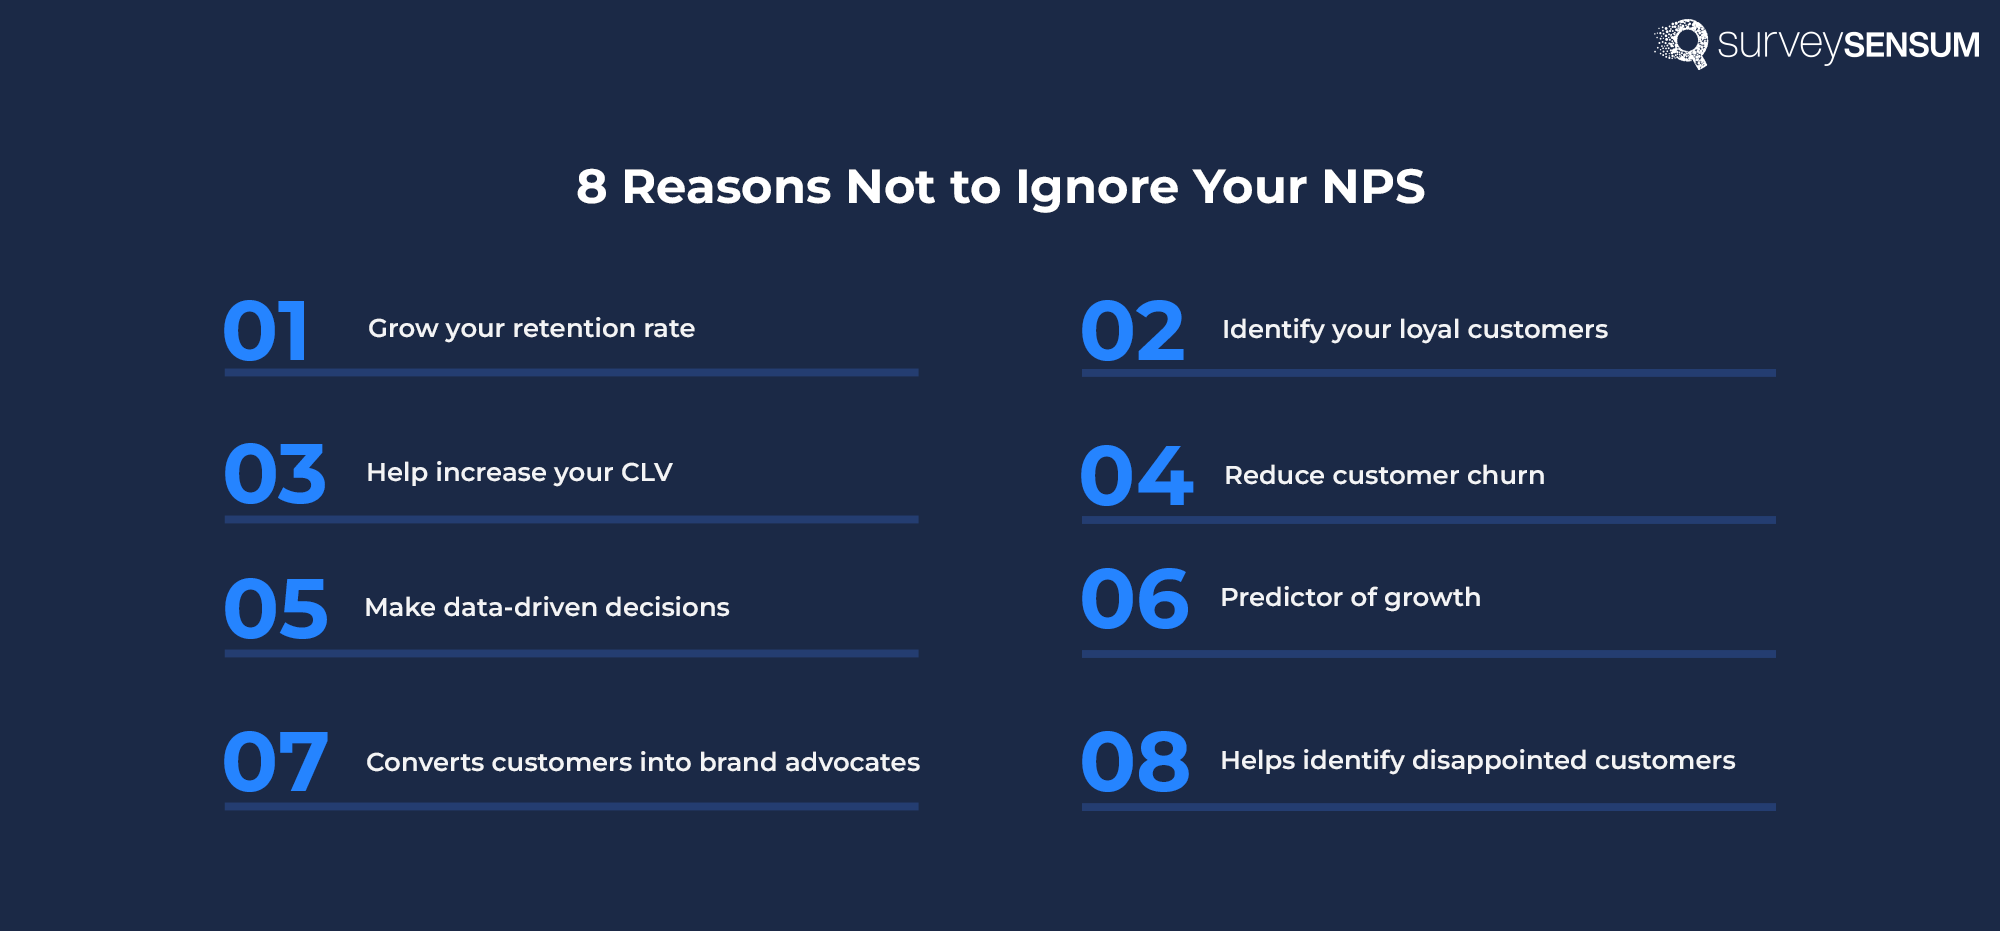
- NPS helps identify loyal customers who stay with you for a longer time and this helps you increase your retention rate, increasing customer retention rates by 5% can increase profits by 25% to 95%.
- Loyal customers buy more, spend more, and persuade others to buy from the same business. In fact, acquiring a new customer is 5 to 25 times more expensive than retaining an existing one.
- Businesses can focus more on retaining loyal customers and offering personalized service. This can help increase CLV.
- An increase in customer retention rate indicates reduced customer churn.
- The qualitative feedback you get from the NPS survey can be used to make data-driven decisions in improving your product/service.
- NPS score acts as an indicator of how well your business is performing. So, if there is a drop in your NPS, you can expect a decline in revenue, sales, and higher customer churn and work accordingly to improve it.
- The higher the NPS score of a business, the higher the number of customers it has who are likely to recommend it to others.
- NPS helps identify who your disappointed customers are from the surveys. As a result, you can provide immediate resolution to their issues or problems. In fact, 50% of customers who leave a negative review expect a response within 7 days.
A core focus of business is to keep their customers happy, and NPS is the easiest way to understand how happy the customers are.
Creating an NPS survey can be a time-consuming process, but it doesn’t have to be. With SurveySensum’s industry-specific survey templates, you can create and launch surveys in under 5 minutes!
Now that you know NPS is really important for your customer experience, it’s time to create an NPS survey!
NOTE: An efficient NPS software helps you create lucrative NPS surveys and launch them at the right touchpoint and at the right time. Also, the tool helps share alerts to the team when a detractor shares their feedback and analyzes all the feedback. Not only will it help you close the loop in time, but it will also help you create an efficient NPS program.
You’ve launched the survey and started gathering feedback. It’s time to analyze the NPS feedback.
How to Analyze NPS Survey Feedback?
Now that you have sent the NPS survey at the right time, what should you do with the valuable customer feedback? How to do an NPS analysis that will drive success?
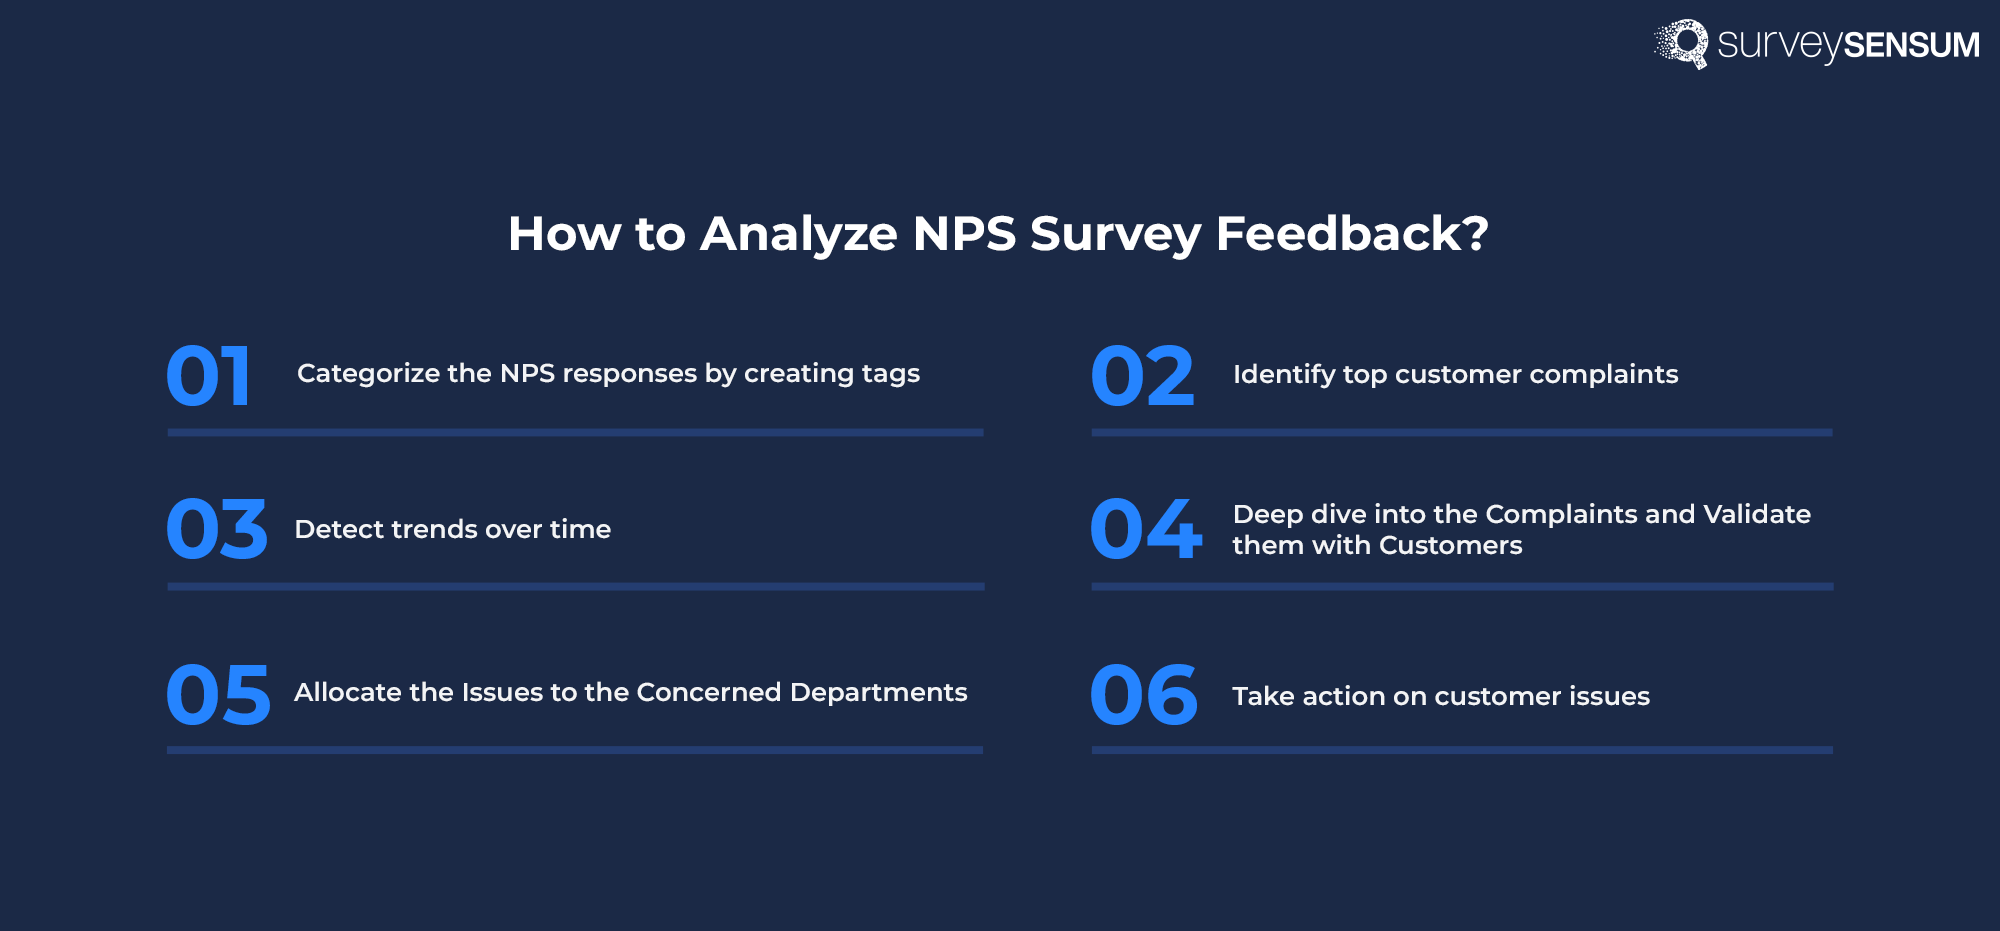
Here’s what you can do!
-
Categorize the NPS Responses by Creating Tags
Categorizing responses into tags based on department, functionality, features, and other criteria helps in identifying trends and assigning issues for action plans. However, manually tagging feedback can be time-consuming and prone to errors.

To streamline this process, SurveySensum’s Text Analytics tool leverages AI to automate tag creation. It intelligently categorizes feedback for you, reducing manual effort and ensuring accuracy. Additionally, if you prefer more control, you can train the AI to align with your specific requirements, allowing it to tag responses based on your customized parameters.
-
Identify Top Customer Complaints

With your tag list and keywords now finalized, it’s time to focus on identifying 3 to 5 key pain points by scrutinizing tags with the highest frequency, negative sentiment, and low NPS scores. This analytical approach provides a clear roadmap for improving existing products, services, or overall customer experiences.
-
Detect Trends Over Time

Track survey results periodically, searching for trends. Regularly sending surveys helps identify changes in customer behavior or opinions. Analyze feedback over time to pinpoint preferences, dislikes, and potential issues.
-
Deep Dive into the Complaints and Validate them with Customers
To gain a deeper understanding of the issue, analyze if the problem is mentioned on other channels, like support tickets or review platforms. Engage front-line employees to gather insights from their interactions with customers and most importantly, communicate directly with customers.
-
Allocate the Issues to the Concerned Departments
Once trending issues are identified and validated with customers, the next step is assigning them to the appropriate departments like marketing strategy, etc. This will help you develop a comprehensive roadmap with both short-term and long-term strategies.
-
Take Action on Customer Issues

Handling customer issues effectively starts with acknowledging the problem promptly and showing empathy. This builds trust and reassures customers that their concerns are being taken seriously. The next step is to gather relevant details and review past interactions or related records to fully understand the issue.
To enhance this process, SurveySensum’s real-time ticketing management system ensures that every complaint is tracked, assigned, and addressed without delays. It keeps customers informed with regular updates and clear expectations, reducing frustration and improving satisfaction.
Creating, launching, and gathering survey data is not the endgame, you also need to analyze and extract actionable insights from your NPS feedback. But fret not! With SurveySensum’s robust NPS software and a team of top CX experts, you can prioritize your actions and turn your feedback into revenue today!
Given its significance, how do you improve your Net Promoter Score?
How to Improve your NPS?
As discussed, if your business’s NPS score is lower than your competitors or the industry average, then it’s high time you improve it.
Following are a few pointers on how to improve your NPS score –
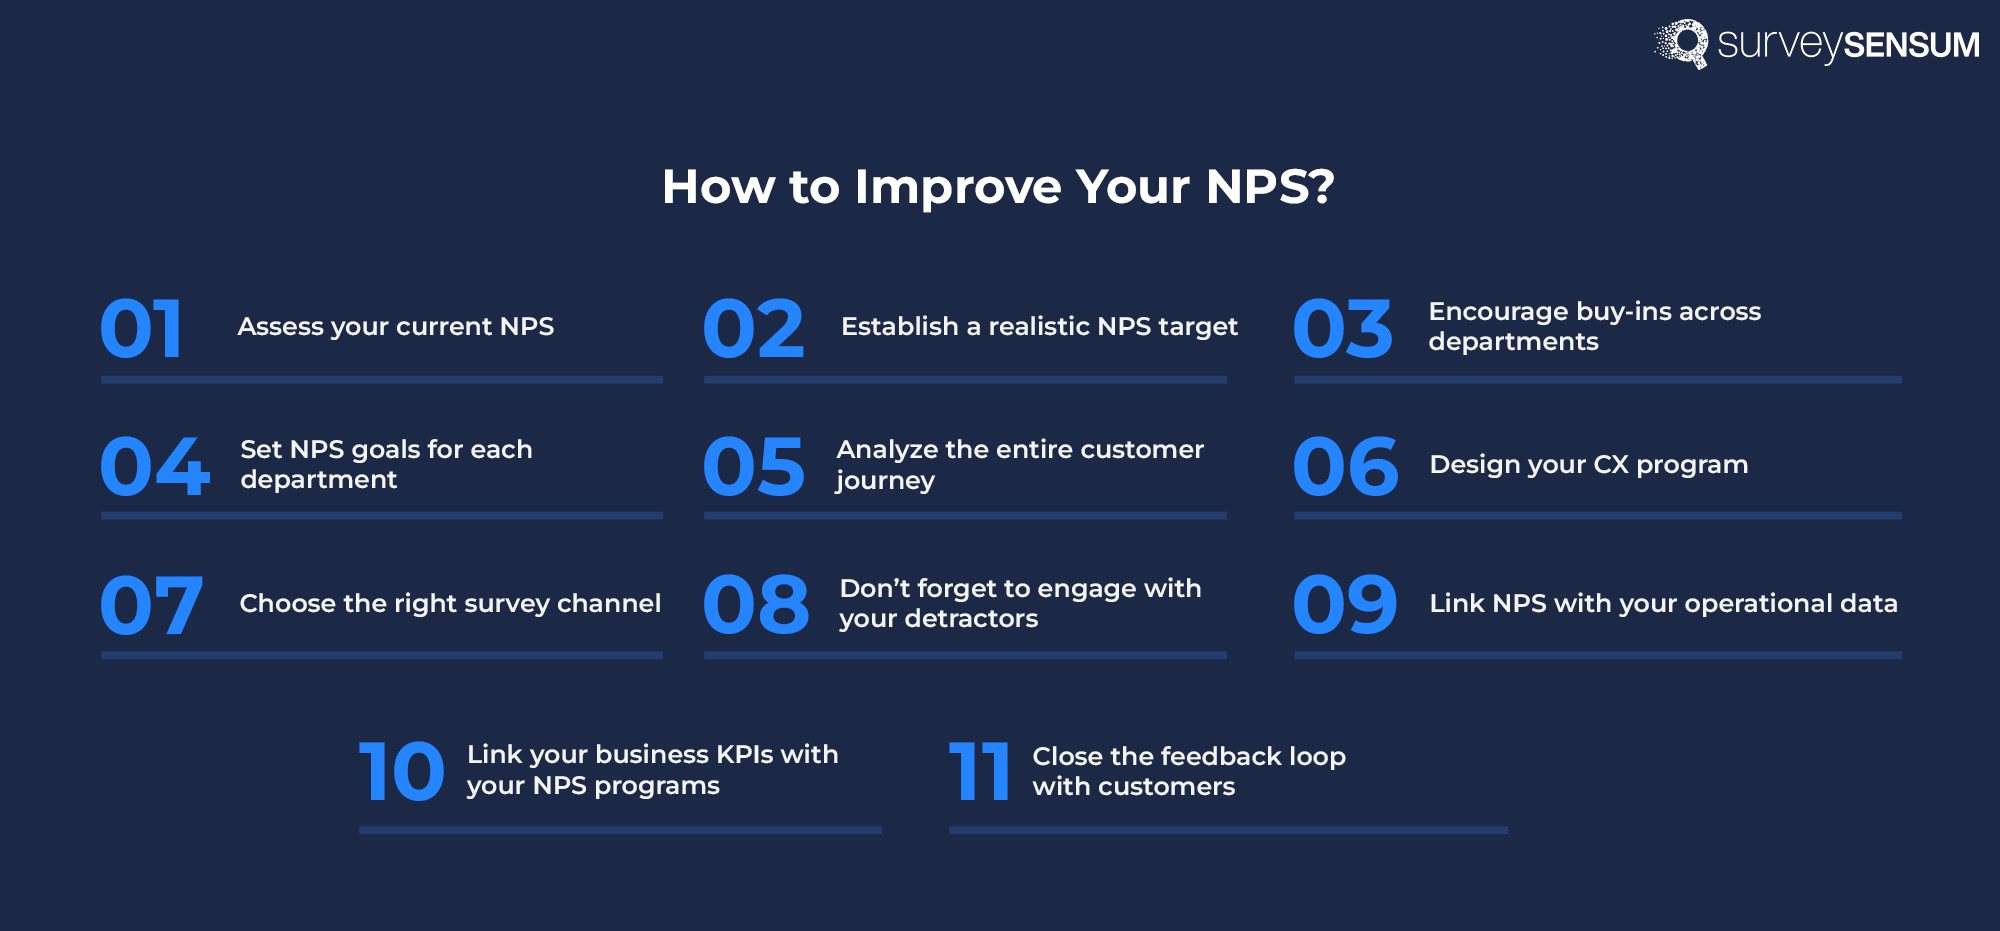
- Before implementing any strategies, it’s crucial to assess your current NPS. Understanding your baseline score provides a starting point for improvement and allows you to track progress over time.
- Establishing a realistic NPS target gives your team a clear objective to work towards. Ensure that the goal aligns with your company’s overall objectives and is achievable within a reasonable timeframe.
- Improving NPS requires collaboration across departments. Encourage buy-in from stakeholders across the organization, including sales, marketing, etc.
- Improving NPS is not a single department’s responsibility, it has to happen from top to bottom. This is because how a customer service representative treats your customer impacts the overall customer experience.
- Understanding customer feedback at individual touchpoints won’t help you. To truly understand the root cause of the problem, you need to get the full picture of customer behavior by analyzing the entire customer journey.
- Develop a comprehensive customer experience program that addresses pain points and enhances satisfaction at every interaction.
- Connect with your customers through the right channels and increase your response rate, thereby improving your NPS score. Once you have selected the channels it’s time to launch the survey.
- Don’t forget to engage with your detractors. Run text analysis on open-ended responses, identify recurring themes, and make a plan of action.
- Your NPS program will yield far more significant insights when you connect your experience data with your operational data residing in your CRM.
- Link your business KPIs with your NPS programs depending on which stage you are at and what is more important to you; be it churn, retention, or net revenue.
- Make sure you inform customers that you have resolved their problems. The most relevant step of all is that this will not only convert your detractors into promoters but also create brand advocates.
Customer feedback is a goldmine of crucial insights and with the above section, we understand how to streamline the feedback analysis process and ultimately improve NPS. However, with data coming in from all directions it can be difficult to track, measure, and analyze such large volumes of data. This is where AI capabilities can transform what once was a time-consuming process into a streamlined, efficient, and insightful operation.
AI-powered feedback analysis tools leverage technologies like NLP and machine learning to sift through customer comments, reviews, and survey responses in record time. These AI capabilities categorize feedback into themes, detect sentiment, and identify trends that might otherwise go unnoticed. Another big advantage is its ability to provide real-time insights. Instead of waiting for manual reports, businesses can instantly spot emerging patterns and act quickly to address customer concerns or capitalize on opportunities.
How to Choose the Right NPS Tool for Your Survey?
Choosing the right NPS tool for your survey ensures that you gather accurate data and insights from your customers. The following are some factors to consider before selecting an NPS tool.
To Launch

- In-built survey templates that enable you to fully customize, personalize, and white label your NPS survey in just a few clicks.
- Look for a tool with conditional survey logic features to personalize follow-up questions and a tailored thank you page to redirect the promoters and detractors for actionability.
- Choose a tool that allows you to incorporate different types of question types, such as multiple choice, open-ended, and rating scales, into your survey.
With SurveySensum’s AI-powered survey builder with DIY capabilities, you can design NPS surveys with industry-specific survey templates, personalize the look and feel of the survey to match your business identity, and ask relevant questions with its question bank.
To Distribute

- Reach your customers where they are most active. Share your survey across multiple channels at optimal times to ensure maximum participation.
- Boost your NPS response rate effortlessly by setting up automated reminders for non-responders to ensure your survey gets the attention it deserves.
- Integrate with your existing systems or manually upload contacts with a CSV file to distribute the NPS survey directly from within the software.
With SurveySensum’s AI-enabled customer feedback platform, you can distribute the survey via multiple channels like WhatsApp, Email, etc to gather data from all these channels and consolidate data for omnichannel feedback management.
To Close the Loop

- Ensure quick resolution by sharing detractor alerts with the relevant team members on their preferred channels to close the feedback loop.
- Keep track of the number of tickets created, opened, resolved, escalated, and average closure time with a real-time ticketing system.
With SurveySensum’s real-time closed loop ticketing system, you can facilitate quick resolution by sharing detractor alerts with appropriate team members to guarantee prompt and effective resolution.
To Analyse

- Eliminate the hassle of manual spreadsheet analysis. Look for a tool that allows you to harness AI to automate and accelerate your NPS analysis.
- Choose a tool with advanced capabilities like NPS text analytics software that enables you to quickly identify key trends and sentiments from open-ended feedback, gaining valuable insights in just seconds. You can boost your score by delving into NPS in text analytics.
- Dig deeper into your scores by analyzing customer segments (by demographics, product usage, etc.) to reveal the underlying reasons behind the feedback.
With SurveySensum’s AI capabilities like text analytics, cross-tab analysis, etc you can segment data, identify top customer complaints, and enable you to take prioritized action.
To Visualise
- The real-time ticketing system enables you to see all your responses as they come in, with no waiting.
- Define and track your NPS goals over time, visualizing your progress and pinpointing areas for improvement effortlessly.
- Look for a tool that saves time and effort on report creation by generating customized reports automatically, tailored to your specific needs, ensuring stakeholders stay informed.
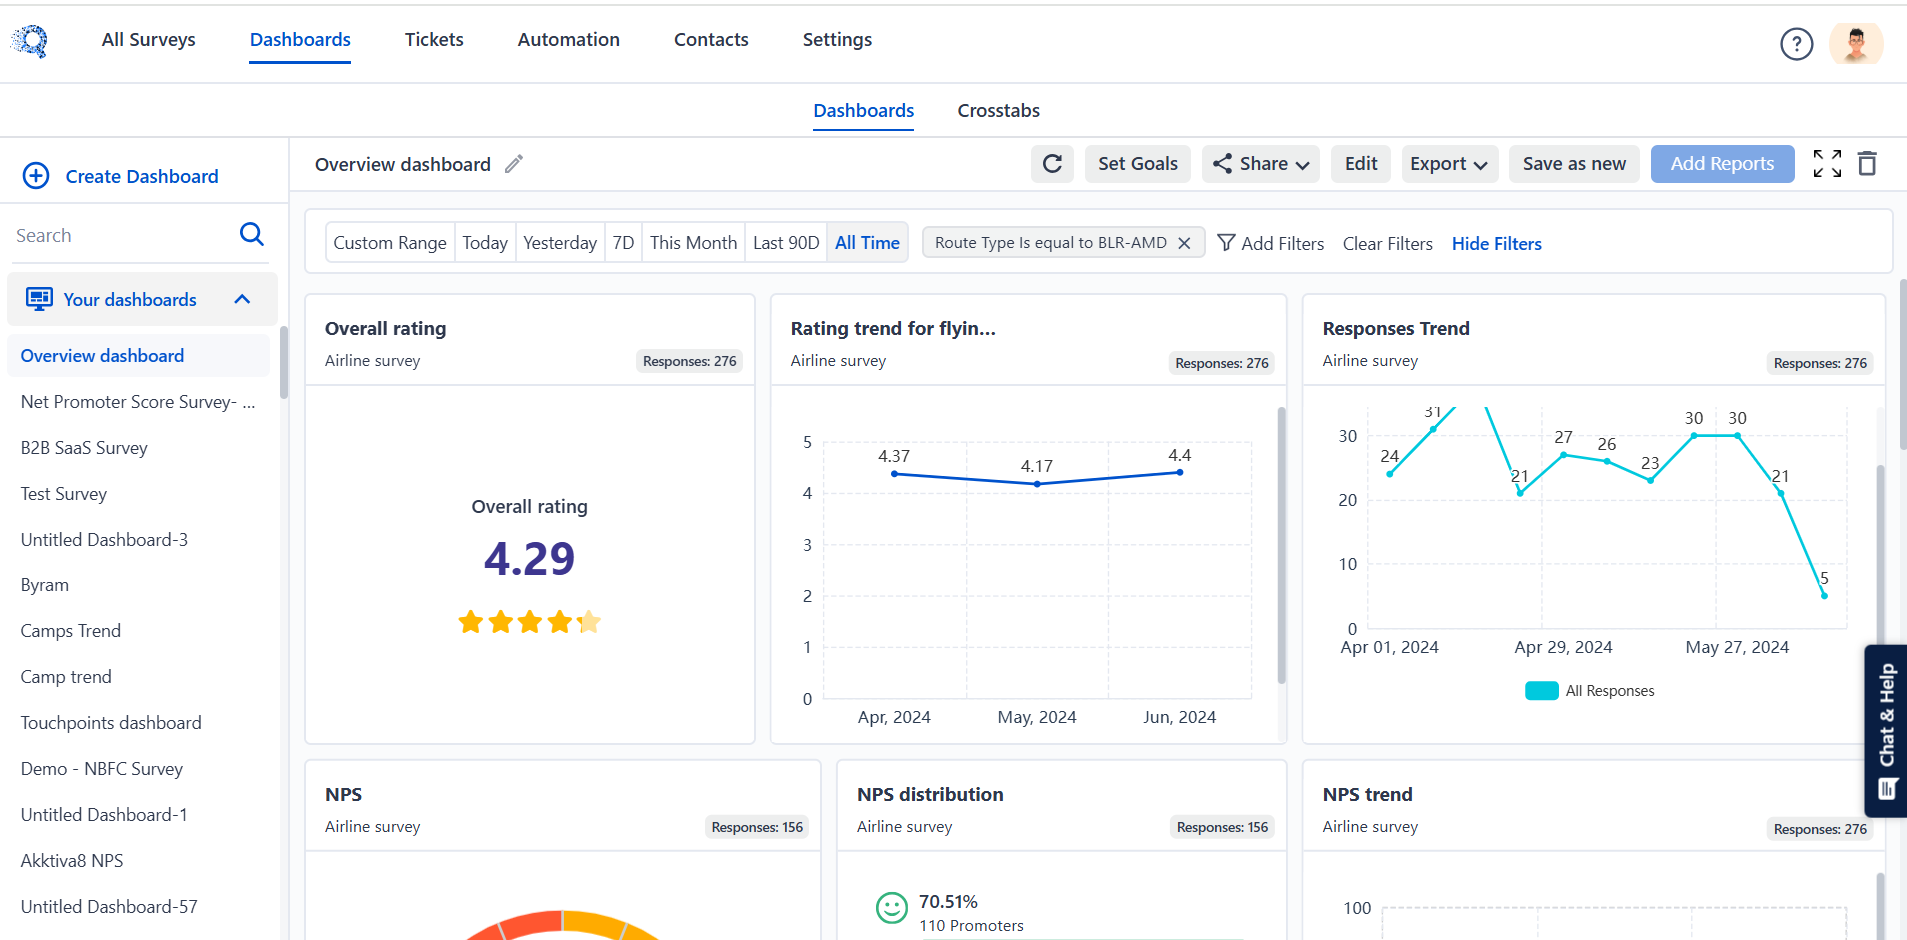
With SurveySensum’s NPS dashboard, you gain a better understanding and visualization of your NPS program. The dashboard includes different elements like overall NPS score, NPS categories, NPS response rate, average completion rate, NPS trends over time, actionable recommendations, NPS benchmarks, etc.
To Take Action
- The right NPS tool enables you to discover the key drivers that significantly influence your NPS score, prioritized for strategic enhancements in customer satisfaction and loyalty.
- With proper consultation and implementation support, you can directly link NPS with revenue growth by identifying promoters who drive new sales via referrals, reducing churn by addressing detractor issues, and pinpointing key drivers to make impactful changes that improve NPS.
- Affordability: Choose Best NPS software tools and software that offer a good balance between functionality and cost. Look for solutions that provide essential features without excessive costs.
- Exceptional Support: Ensure that the tool’s customer support team is well-trained and equipped to handle issues promptly and effectively. This includes having a robust knowledge base and support infrastructure.
With SurveySensum, you not only gain actionable insights that enable you to take prioritized and relevant action, but you also get personalized CX consultation from CX experts that help you create action plans that will be aligned with your business KPIs.
Last but not least, let’s discuss what can be done with your NPS score in terms of driving business success.
What Can You Do with Your NPS Score?
Understanding what to do with your NPS insights is what drives business growth and success, so here are key implementations for your NPS insights.
1. Segmentation of Responses for Tailored Action Plans

NPS scores are categorized into three categories – Detractors, Passives, and Promoters, however, the real power lies in diving deeper into these categories and designing targeted campaigns for each of these categories to drive real impact. This ensures that you are taking personalized data-driven actions that cater to the unique needs of each customer group.
- For Promoters: Encourage brand advocacy by rewarding loyalty. Offer referral programs or exclusive benefits to keep them engaged.
- For Passives: Understand what’s holding them back from becoming promoters. Small tweaks in your offerings or service may turn them into loyal advocates.
- For Detractors: Focus on addressing their concerns. Identifying recurring complaints can help resolve pain points and reduce churn.
With SurveySensum’s AI-powered NPS software, you can gain detailed analytical reports that will help you gain better visualization of your NPS program. Along with a bird’s eye view of different aspects of the NPS program like NPS categories, NPS trends, NPS response rate, etc, you also get detailed insights into each of these aspects.
2. Predicting Customer Churn with NPS Data

NPS doesn’t just measure your customer loyalty – it is also a predictive tool that analyzes customer feedback, especially of your detractors, and addresses their issues proactively, so you can mitigate the risk of losing them.
AI-powered tools can enhance this process by identifying patterns in detractor feedback, such as repeated mentions of poor support, pricing concerns, or product quality issues. With these insights, you can implement targeted retention strategies, such as offering personalized discounts or reaching out with dedicated support to resolve their frustrations.
With SurveySensum’s AI capabilities, you can identify trending patterns, customer complaints, etc that will help you gain insight into major issues that require immediate attention and enable you to take prompt and predictive action that will prevent possible churn.
3. Using NPS to Guide Business Strategy
By analyzing the recurring themes in Promoter feedback, you can identify the strengths that set you apart from competitors and double down on them. Similarly, detractor feedback can reveal areas that require immediate improvement, such as product features, delivery processes, or customer support. Aligning your business strategy with these insights ensures you’re prioritizing initiatives that resonate most with your customers.
Additionally, NPS trends over time can highlight the impact of your strategic efforts. A consistent increase in NPS indicates that your CX initiatives are working, while stagnation or decline can signal the need to pivot.
Conclusion
By identifying key drivers of satisfaction and dissatisfaction, measuring NPS at every critical touchpoint, and linking NPS directly to revenue outcomes, businesses can make data-driven decisions that foster customer loyalty and drive growth. However, NPS should not be used in isolation; it is most effective when combined with other feedback tools and integrated into a comprehensive customer experience strategy.
Tools such as SurveySensum, come equipped with features and settings that will help you launch effective NPS programs, evaluate them, and help you take action on the feedback that impacts the bottom line. Not only that, the platform also provides CX consultation from top CX experts to help you gather actionable data points, and prioritize them so that you can transform your feedback into revenue.
Streamline Your NPS Program With SurveySensum’s AI-enabled NPS Software!
Frequently Asked Questions
Generally, NPS above 70% is considered excellent, indicating a high level of customer satisfaction and loyalty. However, the interpretation of NPS can vary depending on industry standards and specific business contexts. It’s essential to do NPS benchmarking by comparing your score to industry benchmarks and tracking trends over time for a comprehensive understanding.
The three types of Net Promoter Score (NPS) are:
- Relationship NPS: Measures overall customer satisfaction and loyalty over time.
- Transactional NPS: Focuses on specific interactions or transactions with the company.
- eNPS: Evaluates employee satisfaction and loyalty, often used for internal feedback and organizational improvement.
A good eNPS typically falls within the range of 0 to 100, with higher scores indicating higher employee satisfaction and loyalty. While specific benchmarks may vary by industry and organization, eNPS scores above 0 are generally considered positive, and scores above 50 are often seen as exceptional.
The frequency of NPS surveys depends on your business type and customer interaction. For tNPS (e.g., after a purchase or service), sending surveys immediately or within a few days works best. For rNPS, consider a quarterly or biannual approach to gauge overall loyalty and satisfaction trends without overwhelming your customers.
NPS identifies detractors who are at risk of churning. By analyzing their feedback and addressing concerns proactively, you can resolve issues before they escalate. Additionally, engaging promoters strengthens loyalty, encouraging them to stay longer and even recommend your brand to others.
Yes, eNPS measures how likely your employees are to recommend your company as a great place to work. It provides insights into workplace satisfaction, identifies areas for improvement, and helps create a more engaged and motivated workforce – just like NPS does for customers.


